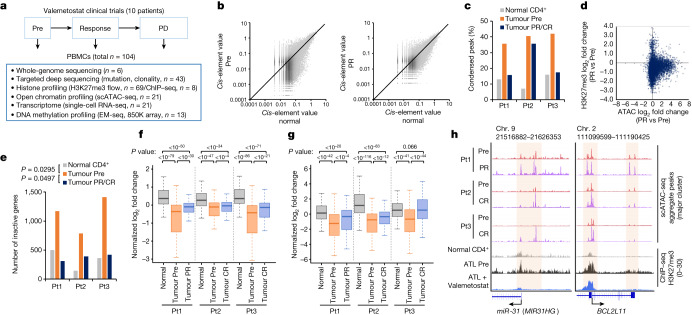
Fig. 2. Chromatin decondensation by valemetostat.
a, The workflow illustrates the collection and processing of fresh peripheral blood samples from a clinical trial and the following multilayered experimental platform. ChIP–seq, chromatin immunoprecipitation with sequencing. EM-seq, enzymatic methyl sequencing. b, All ATAC peak values (total 69,544 peaks) of tumour cells (y axis) at pre-treatment (left) and after treatment (48 weeks; right) versus normal CD4+ T cells (x axis) in a representative case (Pt1). c, Proportion of chromatin-condensed peaks (cis-element value < 0.01) from scATAC-seq data in three patients. d, Scatter plot of log2 fold changes of ATAC (x axis) and H3K27me3 (y axis) at partial response (48 weeks) for all gene promoter regions in Pt1. e, Numbers of chromatin inactive genes (promoter sum < 0.01) in three patients. f,g, Box plots summarize normalized log2 fold changes of scATAC-seq promoter activities (f) and scRNA-seq gene expression (g) at H3K27me3 target genes (563 genes) in three patients. Statistical significance is provided only for main combinations. The middle line within the box plots corresponds to the median; the lower and upper hinges correspond to the first and third quartiles; the upper whisker extends from the hinge to the largest value no further than 1.5 times the interquartile range (IQR); and the lower whisker extends from the hinge to the smallest value at most 1.5 times the IQR. h, Aggregate scATAC tracks and H3K27me3 distribution before and after valemetostat treatment at the representative H3K27me3 target loci (miR-31 and BCL2L11) in three patients. Highlighted regions show chromatin decondensation by valemetostat. Statistics and reproducibility are described in the Methods.

