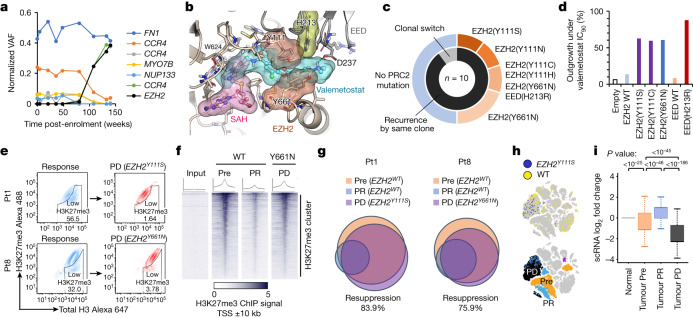
Fig. 3. Mechanisms of resistance to valemetostat.
a, Chronological transition of VAF values (normalized by proviral load) for somatic mutations identified by deep sequencing in Pt1 in relation to treatment with valemetostat. b, Model of the PRC2–valemetostat complex superimposed on the PRC2–S-adenosyl-l-homocysteine (SAH) complex, with molecular surfaces of ligands and mutation sites on EZH2 and/or EED identified in the clinical trials. c, Nested pie chart shows the proportion of PRC2 mutations and clonal characteristics at progressive disease. d, ATL cells (TL-Om1) with PRC2 mutations were treated with valemetostat (90% inhibitory concentration (IC90) or more) and monitored for outgrowth for 37 days. The bar graph shows the percentage of recovered outgrowth clones (outgrowth activity among 96 clones) for each cell with PRC2 mutations. WT, wild type. e, H3K27me3 staining of PBMCs in Pt1 and Pt8 gated on CD4+CADM1+CD7− tumour cell populations at clinical response and at progressive disease. f, Heat maps of H3K27me3 ChIP–seq peaks centred on the TSS (20-kb windows) at H3K27me3 clusters in tumours from Pt8 at Pre, partial response and progressive disease (EZH2Y661N). g, Venn diagram depicts overlapped chromatin-condensed inactive genes (promoter sum < 0.01) in tumour cells from Pt1 and Pt8 at Pre, partial response and progressive disease. h, t-SNE projection of scRNA-seq data in Pt1, with cells coloured according to EZH2Y111S RNA status (top) and assigned major tumour clusters (bottom). i, Normalized log2 fold changes of scRNA-seq gene expression at the chromatin-condensed inactive genes from Pt1 (scATAC-seq promoter sum < 0.01 before treatment, n = 1,080 genes). The middle line within box plots corresponds to the median; the lower and upper hinges correspond to the first and third quartiles; the upper whisker extends from the hinge to the largest value no further than 1.5 times the IQR; and the lower whisker extends from the hinge to the smallest value at most 1.5 times the IQR. Statistics and reproducibility are described in the Methods.

