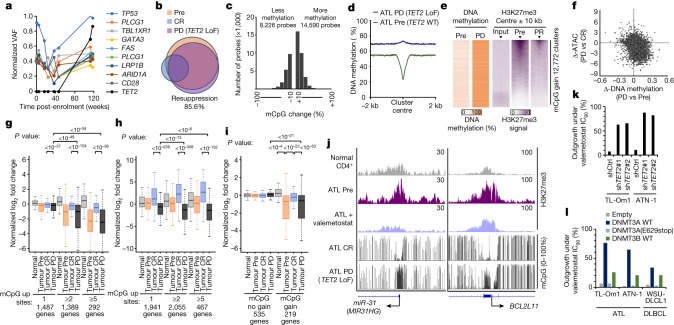
Fig. 4. Non-genetic mechanisms of resistance to valemetostat.
a, Chronological transition of normalized VAF values for somatic mutations in Pt3. b, Venn diagram depicts overlapped chromatin-condensed inactive genes (promoter sum < 0.01) in tumour cells from Pt3. LoF, loss of function. c, Histogram shows differentially methylated (ΔmCpG < −10% or ΔmCpG > 10%) probes in resistant tumour from Pt3 at progressive disease (118 weeks) versus pre-treatment tumour. d, Whole-genome DNA methylation profiling detected progressive disease-associated mCpG acquisition clusters. The plot shows average DNA methylation (%) in tumour baseline (Pre) and at progressive disease centred by mCpG gain 12,772 clusters. e, Heat maps of DNA methylation and H3K27me3 ChIP–seq peaks (20-kb windows) at progressive disease-associated mCpG gain clusters. The arrowheads indicate cluster centre. f, Correlation between Δ-DNA methylation (%) and Δ-scATAC-seq promoter sum in the resistant cells versus pre-treatment cells from Pt3. g,h, Normalized log2 fold changes of scATAC-seq promoter activities (g) and scRNA-seq gene expression (h) in relation to treatment-associated mCpG gain in Pt3. Statistical significance is provided only for main combinations. i, Normalized log2 fold changes of scATAC-seq promoter activities of TSGs. Statistical significance is provided only for main combinations. In g–i, the middle line within box plots corresponds to the median; the lower and upper hinges correspond to the first and third quartiles; the upper whisker extends from the hinge to the largest value no further than 1.5 times the IQR; and the lower whisker extends from the hinge to the smallest value at most 1.5 times the IQR. j, Representative tracks for H3K27me3 (ChIP–seq) and methylated CpG tracks (EM-seq) (16 weeks (complete response) and 118 weeks (progressive disease) with TET2 LoF) around the TSS. k,l, Bar graphs show the percentage of recovered outgrowth clones (outgrowth activity among 96 clones) under the valemetostat IC90 or higher condition for each lymphoma cell with TET2 knockdown (k) and ectopic DNMT3A or DNMT3B expression (l). DLBCL, diffuse large B cell lymphoma; shCtrl, control shRNA. Statistics and reproducibility are described in the Methods.

