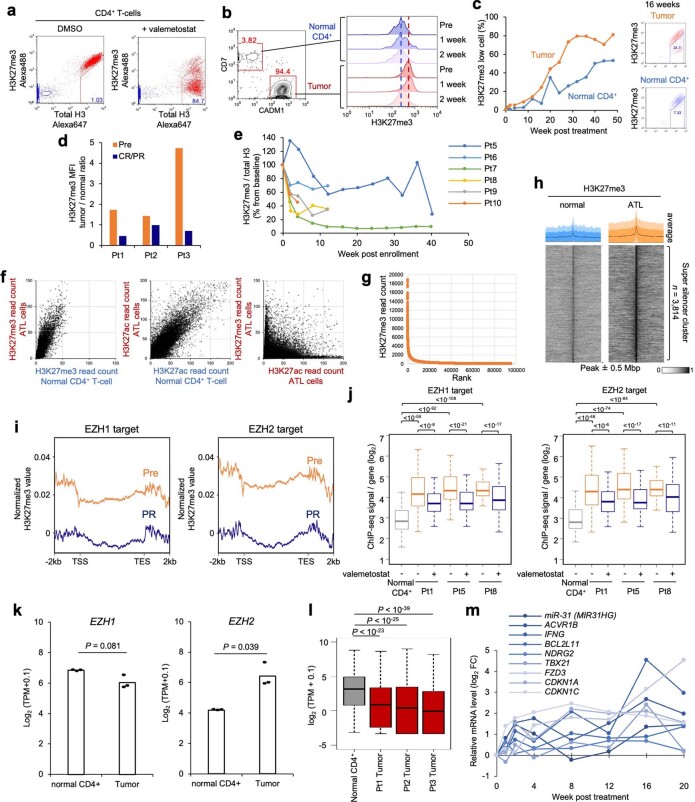
Extended Data Fig. 2. H3K27me3 reduction by valemetostat.
a, Establishment of H3K27me3-flow system. Intracellular H3K27me3 / total histone H3 were stained with specific antibodies in PHA-activated PBMC. Treatment with 100 nM valemetostat for 7 days significantly reduced the H3K27me3 level. Red cells, antibody + ; blue cells, isotype control. b, H3K27me3 levels in tumor (CD4+/CADM1+/CD7−) and normal (CD4+/CADM1−/CD7+) cell populations at 0, 1, and 2 weeks post valemetostat treatment in Pt1. Dashed lines indicate baselines. c, Changes over time in population size of low H3K27me3 cells (%) in Pt1. d, Tumor H3K27me3 levels (mean fluorescence intensity, MFI) normalized by the level of normal CD4+ T-cells at pre-treatment (Pre) and at the time of clinical response (PR/CR). e, Changes of tumor H3K27me3 level (% from baseline) in valemetostat phase 2 study. f, ChIP-seq signal values of H3K27me3 (left panel) and H3K27ac (middle panel) at all gene promoters (32,747 genes) in Pt1 tumor cells (y-axis) versus normal CD4+ T-cells (x-axis). The distribution of the H3K27me3 and H3K27ac peaks was mutually exclusive (right panel). g, h, H3K27me3 enriched super-silencer clusters in ATL cells. Rank ordering of H3K27me3 ChIP-seq signals identified the super-silencer clusters (g). Heatmaps and average profiles show ChIP-seq signals centered on peaks, ranked by mean H3K27me3 level, in normal CD4+ T-cells and ATL cells (h). i, j, Average ChIP-seq TSS-TES plot (i) and H3K27me3 log10 signals at promoter regions (j) bound by EZH1 (n = 347 genes) and EZH2 (n = 269 genes) in Pt1, Pt5, and Pt8. EZH1 and EZH2 ChIP data resources10 were re-analyzed. k, l, Baseline expression [Log2(TPM + 0.1)] of EZH1 and EZH2 mRNA (k) and H3K27me3 target genes (n = 630) (l) in tumor cells from three patients and normal CD4+ T cells from healthy donors. Tumor-specific RNA was collected by CD4+/CADM1+/CD7− cell sorting and analyzed by RNA-seq. m, Relative expression changes (log2 fold-change) of the representative H3K27me3 target genes post valemetostat treatment in Pt1. The middle lines within box plots correspond to the medians; lower and upper hinges correspond to the first and third quartiles. The upper whisker extends from the hinge to the largest value no further than 1.5 * IQR. The lower whisker extends from the hinge to the smallest value at most 1.5 * IQR. Statistics and reproducibility are described in Methods.

