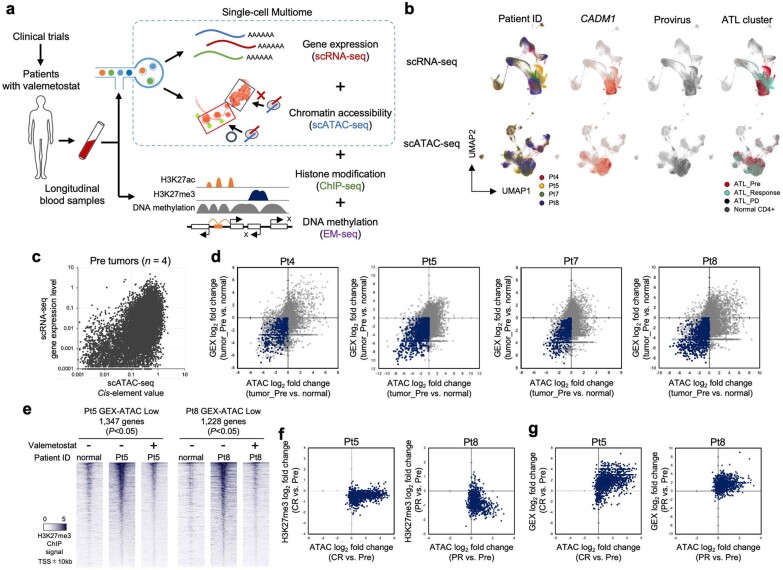
Extended Data Fig. 4. Integrated single-cell analyses for phase 2 validation cohort.
a, Workflow illustrates single-cell analyses platform for phase 2 study. Chromatin structure (ATAC) and gene expression (GEX) data from total 109,830 cells were connected at the single-cell level by the 10x Genomics scMultiome platform. Epigenetic profiling data (ChIP-seq and EM-seq) of corresponding samples are integrated. b, Summary of scMultiome clustering for 11 libraries from 4 patients. Cells were colored according to patient ID, CADM1 expression, provirus read, and assigned major tumor clusters. c, Scatter plot shows scATAC-seq promoter activity (x-axis) and scRNA-seq expression level (y-axis) for all genes in the four tumors before treatment. d, Scatter plots show Log2 fold changes of ATAC (x-axis) and GEX (y-axis) for all genes in Pre tumors vs. normal cells. Gene clusters silenced by the chromatin aggregation (P < 0.05) are indicated by dark blue. e, Heatmaps depict sorted H3K27me3 peaks centered on TSS (20-kb windows) at chromatin inactivated gene clusters in Pt5 and Pt8 before and after valemetostat treatment. f, Scatter plots show Log2 fold changes from baseline of ATAC (x-axis) and H3K27me3 (y-axis) for chromatin inactivated gene clusters at clinical response in Pt5 and Pt8. g, Scatter plots show Log2 fold changes from baseline of ATAC (x-axis) and gene expression (y-axis) for chromatin inactivated gene clusters at clinical response in Pt5 and Pt8.

