Figure 3.
Complementation of the cer10 Mutant and Subcellular Localization of the ECR.
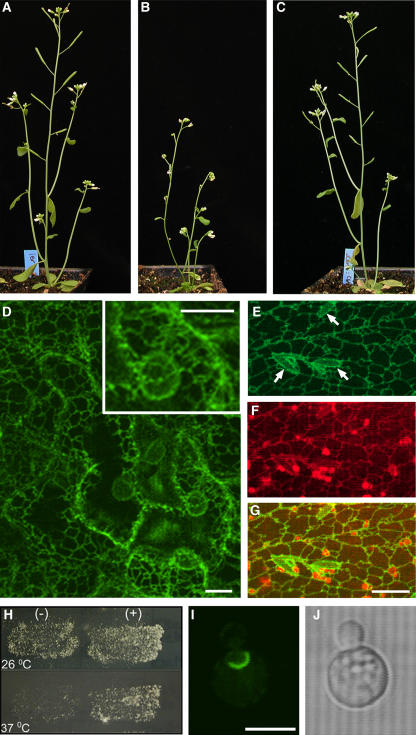
(A) to (C) Four-week-old wild-type Ler (A), cer10-1 (B), and cer10-1:GFP-ECR plants (C).
(D) Projection of 12 × 1-μm optical sections of GFP fluorescence through GFP-ECR expressing cer10-1 leaf epidermal cells. Note the similar fluorescence intensity between cortical ER network and nuclear envelopes. Bars = 5 μm.
(E) to (G) Colocalization of GFP-ECR labeled network (E) and the ER network stained by hexyl rhodamine B (F). (G) was obtained by merging images (E) and (F). The arrows in (E) identify the fusiform bodies of the ER outlined in negative contrast by GFP-ECR. Bar = 10 μm for (E) to (G).
(H) The yeast tsc13-1elo2Δ cells transformed with the plasmid p426-ADH without GFP-ECR growing at 26°C (top left) and at 37°C (bottom left) and the tsc13-1elo2Δ cells transformed with the plasmid p426-ADH:GFP-ECR growing at 26°C (top right) and 37°C (bottom right).
(I) and (J) Confocal GFP fluorescence (I) and bright-field (J) images of a yeast tsc13-1elo2Δ cell expressing GFP-ECR. Bar = 5 μm.

