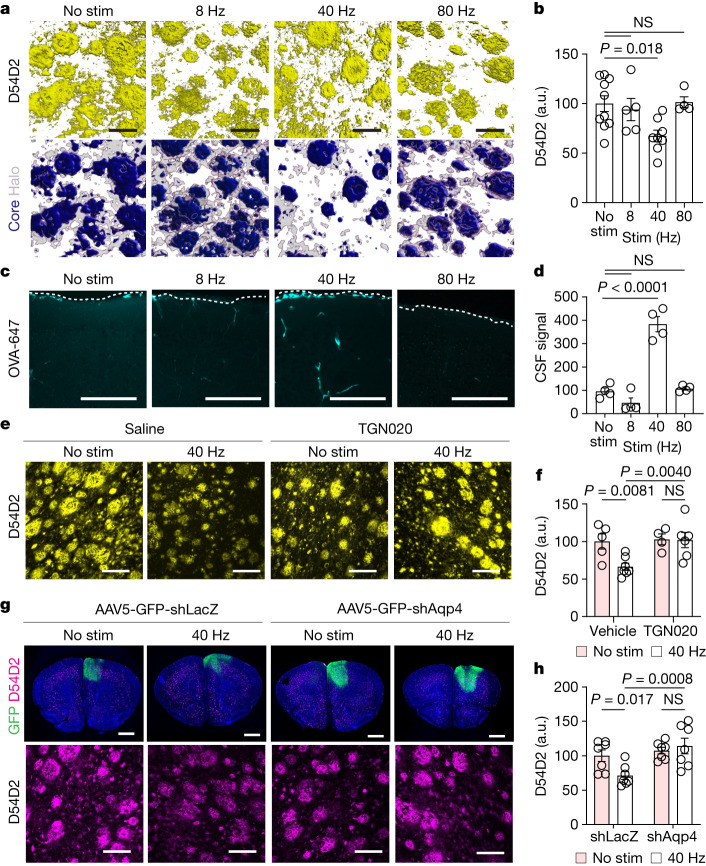
Fig. 1. Multisensory 40 Hz stimulation promotes AQP4-dependent clearance of amyloid.
a, Top row, example confocal z-stack reconstructions of D54D2 (monoclonal β-amyloid antibody) signal from frontal cortex of 6-month-old 5XFAD mice with stimulations at indicated frequency or no stimulation (No stim). Bottom row, amyloid signals based on dense-core and non-core regions. Scale bars, 20 μm. b, Quantification of D54D2 signal intensity in experiments represented in a (n = 10 (no stimulation), 5 (8 Hz), 8 (40 Hz) and 4 (80Hz) 6-month-old 5XFAD mice; P values by one-way analysis of variance (ANOVA) and Dunnett’s multiple comparison test). a.u., arbitrary units; NS, not significant. c, Maximum intensity projections of confocal z-stacks for cisterna magna-infused CSF tracer (OVA-647) imaged in frontal cortex. The dotted line shows cortical surface. Scale bars, 100 μm. d, Quantification of cisterna magna-infused OVA-647 from c (n = 4 6-month-old 5XFAD mice per condition; P values by one-way ANOVA and Dunnett’s multiple comparison test). e, Example confocal z-stack projections of D54D2 in frontal cortex of 6-month-old 5XFAD mice. Scale bars, 100 μm. f, Quantification of amyloid signal intensity in frontal cortex (n = 5 (no stimulation), 7 (40 Hz), 4 (no stimulation + TGN020) and 6 (40 Hz + TGN020) 6-month-old 5XFAD mice; P values by two-way ANOVA and Fisher’s least significant difference (LSD) test). g, Top row, example coronal section showing signal from Hoechst (blue), adeno-associated virus (AAV) expressing short hairpin RNA (shRNA) targeting Aqp4 (AAV-eGFP-shAqp4) or lacZ (AAV-eGFP-shLacZ) and D54D2. Bottom row, example confocal z-stack maximum intensity projection of D54D2 signal. Scale bars: 1,000 μm (top), 100 μm (bottom). h, Quantification of D54D2 signal intensity from experiments represented in g (n = 6 (no stimulation), 7 (no stimulation + shLacZ), 7 (40 Hz + shLacZ) and 7 (40 Hz + shAqp4); P values by two-way ANOVA and Fisher’s LSD test; data are mean ± s.e.m.).

