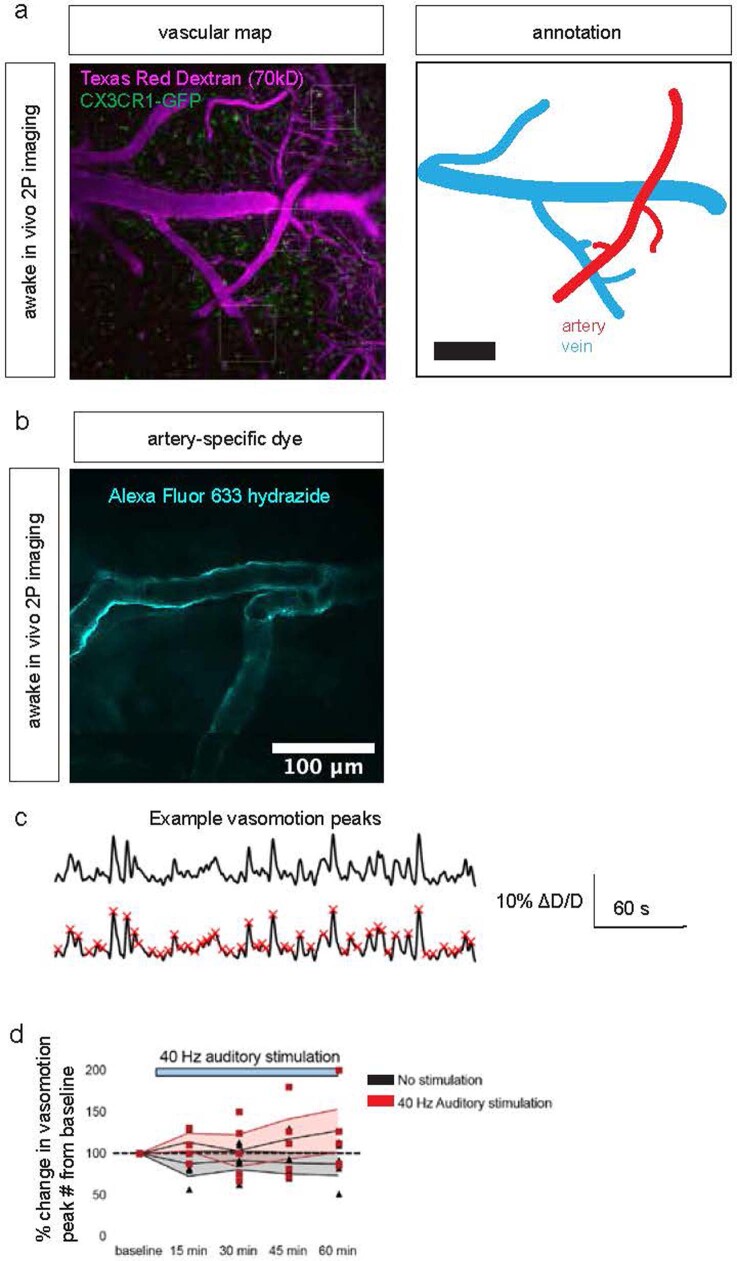
Extended Data Fig. 6. Validation of arterial imaging, including arterial segment identification and motion correction.
a. Example two-photon image of blood (magenta) and microglia (green) to define vascular segments. This experiment annotating vascular segments was used for all 2 P imaging of vasculature. b. Example image of Alexa-633, an artery marker, to define arterial segments. The experiment was repeated twice. Scale bar, 100 μm. c. Example quantification of vasomotion peaks. A Savitzky-Golay filter was applied to the vasomotion trace, and peaks were identified using find_peaks (scipy.signal). d. Longitudinal imaging of 40 Hz auditory stimulation and simultaneous 2 P vasomotion analysis in frontal cortex of 6-month-old 5XFAD mice normalized to baseline at the first imaging session prior to the onset of multisensory 40 Hz stimulation (n = 5 6-month-old 5XFAD mice; data is presented as the mean ± s.e.m).

