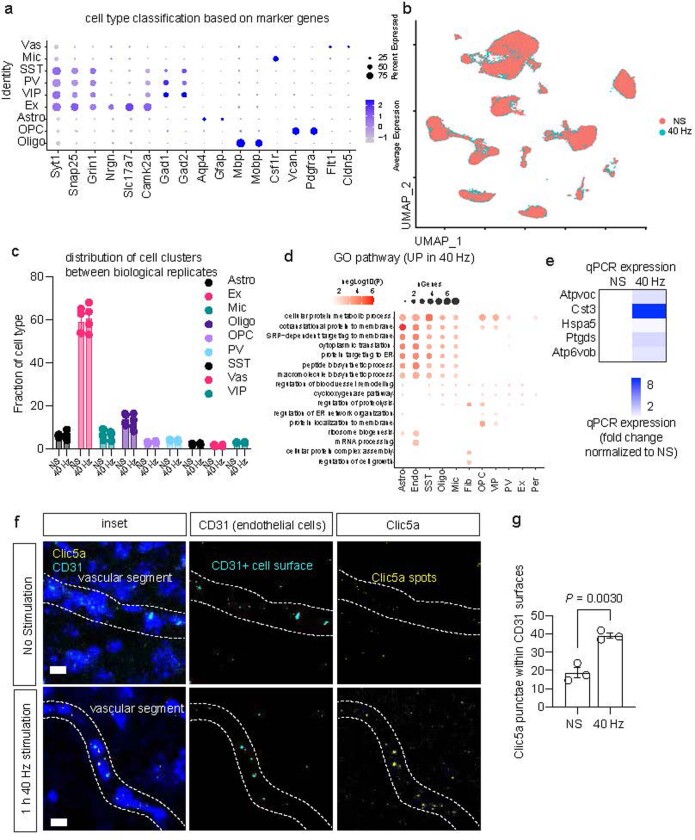
Extended Data Fig. 8. snRNA-seq cell type annotation, analysis, and quality control.
a. Marker genes used for cell type annotation. Cells were classified as excitatory neurons (Ex), parvalbumin interneurons (PV), somatostatin interneurons (SST), and vasoactive intestinal peptide interneurons (VIP), microglia (Mic), astrocytes (Astro), oligodendrocyte precursor cells (OPCs), oligodendrocytes (Oligo), and vascular cells (Vas). Dot size indicates percent expressed, and dot color indicates average gene expression level. b. Distribution of cell types based on stimulation condition between no stimulation (NS) and 40 Hz stimulation (40 Hz). c. Distribution of cell cluster numbers based on biological replicate between no stimulation (NS) and 40 Hz stimulation (40 Hz) (n = 4 biological replicates per group, with each replicate consisting of three 6-month 5XFAD mouse cortex; data is presented as the mean ± s.e.m.; unpaired two-tailed t-test was used for statistical analysis). d. GO analysis of DEGs following snRNA-seq. The test for GO term enrichment was Fisher exact test. e. qPCR was conducted for genes upregulated in at least 3 cell types. A heatmap of expression change is presented, with fold difference calculated using the 2−ΔΔCt method types (n = 5 6-month-old 5XFAD mice per group, performed with two technical duplicates). f. Example confocal z-stack projections of RNA in situ hybridization (RNAscope) in the prefrontal cortex (PFC) of 6-month-old 5XFAD mice with probes to detect CD31 (cyan, endothelial cell marker, not differentially expressed between groups) and Clic5a (yellow; upregulated in 40 Hz). The dotted line represents a putative vascular segment. Scale bar, 10 μm. g. Quantification of Clic5a (yellow spots) in endothelial cells (cyan surface rendering) increased in 40 Hz stimulation (40 Hz) compared to no stimulation (NS) (n = 3 6-month-old 5XFAD mice per group; each data point represents the mean number of Clic5a puncta from CD31+ endothelial cells from 4 confocal z-stacks per mouse; data is presented as the mean ± s.e.m.; P value was calculated by unpaired two-tailed student’s t-test).

