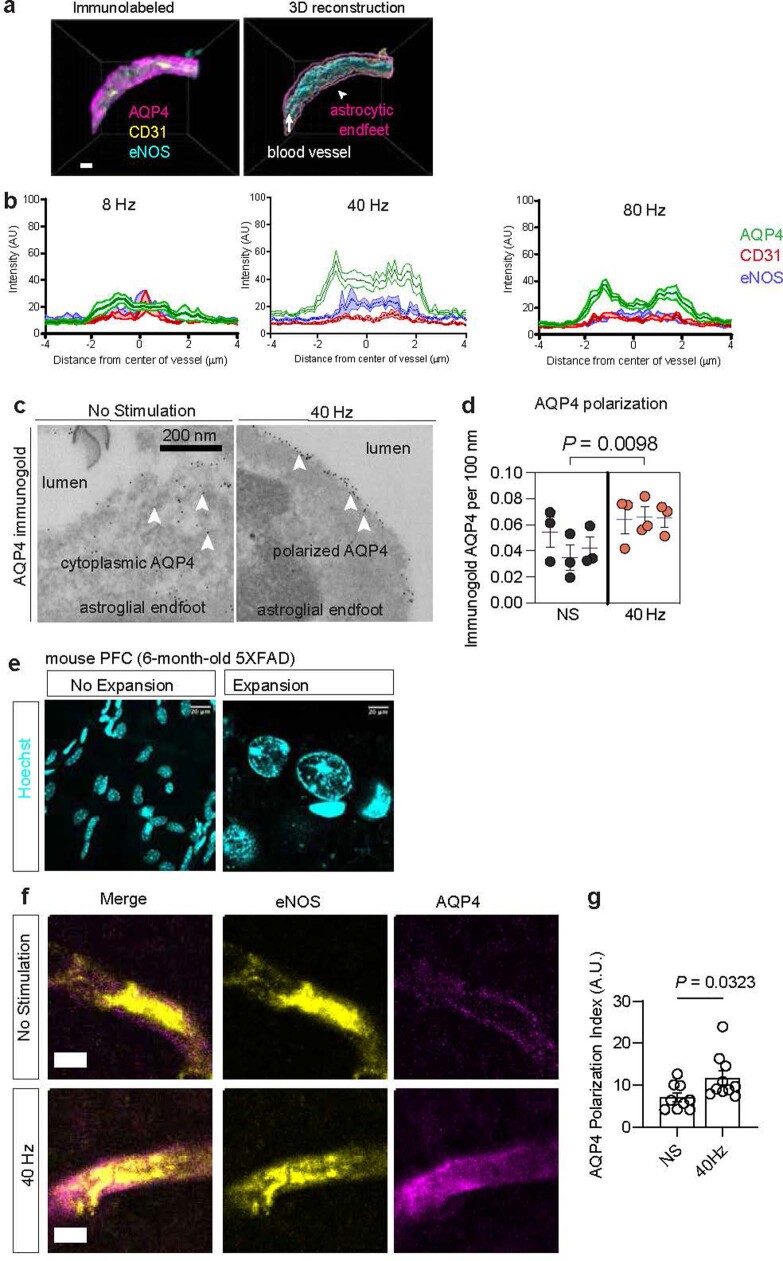
Extended Data Fig. 9. Aquaporin analysis following sensory stimulation.
a. Example confocal image of immunohistochemistry of AQP4 in mouse PFC. Astrocytic endfeet (magenta) are visualized and ensheath the blood vessel, visualized based on endothelial nitric oxide synthase (eNOS) and platelet endothelial cell adhesion molecule-1 (PECAM-1/CD31). 3D reconstruction using Imaris reveals astrocytic endfeet ensheath the blood vessel. Similar vascular segments were obtained for all experiments involving AQP4 polarization analyses presented. b. Example analysis of AQP4 polarization and Imaris 3D reconstruction of astrocytic endfeet from the PFC of a 6-month-old 5XFAD mouse. A perpendicular line segment of astrocytic endfeet was drawn in ImageJ, and the signal intensity of AQP4 was plotted. The distribution of the intensity reveals the polarization of AQP4. The polarization index is quantified by dividing the peak signal intensity of the AQP4 line segment normalized to the background intensity. An increase in the ratio between the peak of AQP4 compared to the background signal intensity signifies an increase in AQP4 polarization. Red, CD31 signal. Green, AQP4 signal. Blue, eNOS signal. The polarization of the green AQP4 signal highlights the ensheathment of AQP4 signal around blood vasculature. Shaded areas represent standard error of the mean. c. Example images of transmission electron microscopy (TEM) resolving astrocytic endfeet and AQP4 distribution (dark puncta). 6-month-old mice received one hour of noninvasive multisensory gamma stimulation or no stimulation control, and 40 μm sections of PFC coronal sections were prepared for TEM imaging. d. Quantification of AQP4 distribution via TEM within astrocytic endfeet in 6-month-old 5XFAD mice (n = 3 6-month-old 5XFAD mice per group; data is presented as the mean ± s.e.m. in a nested plot; P was calculated by nested two-tailed t-test). e. Validation of Expansion Microscopy using DAPI from mouse cortex. Left = no expansion. Right = post expansion; the experiment was repeated three times. Scale bar, 20 μm. f. Example confocal images of Expansion Microscopy of astrocytic endfeet labeled with AQP4 (magenta), the endothelial cell marker endothelial nitric oxide synthetase (yellow). Scale bar, 5 μm. g. Quantification of aquaporin-4 polarization (n = 9 astrocytic endfeet segments for no stimulation and 10 astrocytic endfeet segments for gamma stimulation; data is presented as the mean ± s.e.m.; P was calculated by unpaired two-tailed student’s t-test).

