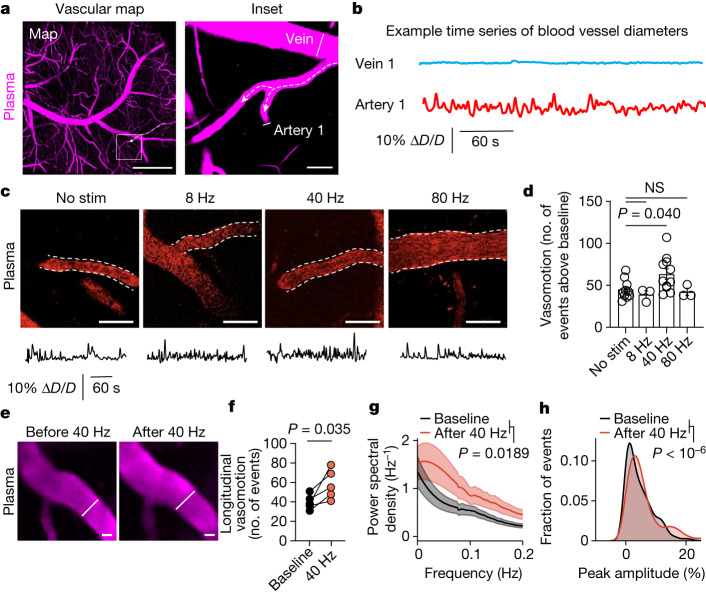
Fig. 2. Multisensory 40 Hz stimulation promotes arterial pulsatility.
a, Example image of blood vessels imaged by two-photon microscopy through a cranial window using Texas Red–dextran 70 kD in 6-month-old 5XFAD mice. Dotted arrows depict blood flow direction, and line segments indicate regions used to quantify blood vessel diameter over time. Scale bars: 500 μm (left) and 20 μm (right). b, Example time series of diameter (D) of blood vessels. ∆D/D is change in blood vessel diameter as a fraction of the mean diameter. c, Example images and traces of vasomotion after multisensory stimulations in 6-month-old 5XFAD mice. Scale bars, 50 μm. d, Number of peaks after 1 h of noninvasive multisensory stimulation in 6-month-old 5XFAD mice (n = 10 (no stimulation), 3 (8 Hz), 11 (40 Hz) and 3 (80 Hz) vascular segments; P values by one-way ANOVA followed by Dunnett’s multiple comparisons test; data are mean ± s.e.m.). e, Repeated imaging of the arterial segments before and after 1 h of noninvasive multisensory gamma stimulation. Example images and representative diameter traces are shown. Scale bars, 20 μm. f, Number of peaks within time series traces from vasomotion patterns for a subset of mice from d imaged longitudinally (n = 5 mice imaged before and after 40 Hz stimulation; P values by paired t-test). g, Fast Fourier transform analysis of arterial vasomotion (n = 5 mice imaged both before and after gamma stimulation; P values by paired t-test; shaded areas represent s.e.m.). h, Distribution of vasomotive events based on amplitude peak over baseline (n = 5 mice imaged both before and after gamma stimulation; P < 10−6 by two-tailed Mann–Whitney test).

