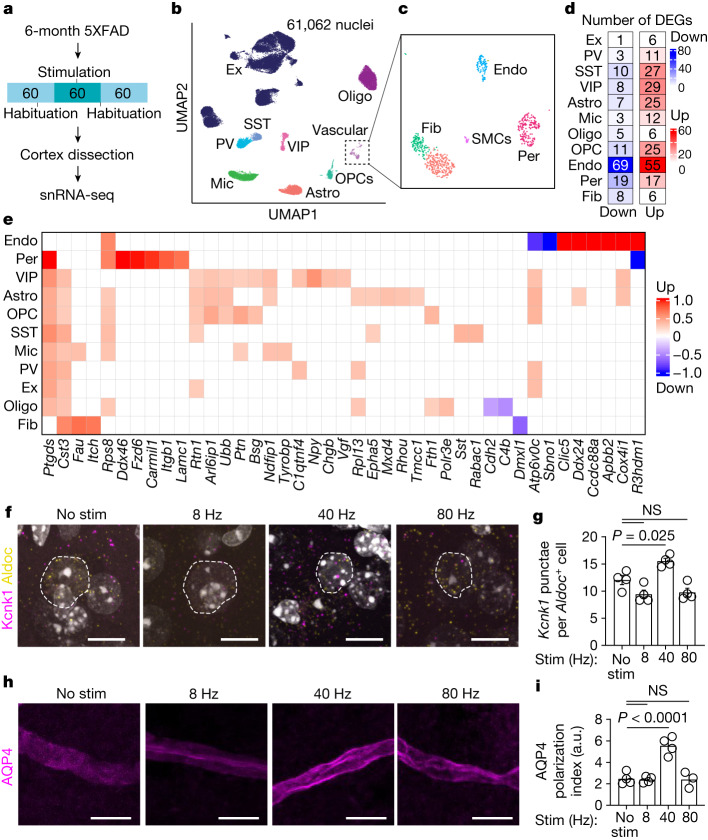
Fig. 3. snRNA-seq of mouse cortex following gamma stimulation reveals changes in astrocyte membrane trafficking.
a, Six-month-old 5XFAD mice were presented with 1 h of 40 Hz multisensory stimulation or no stimulation, allowed to rest for 1 h, and cortex was prepared for snRNA-seq. b, Cell type clustering by uniform manifold approximation and projection (UMAP) of 61,062 high-quality nuclei. Cells were classified as excitatory neurons (Ex), parvalbumin interneurons (PV), somatostatin interneurons (SST), vasoactive intestinal peptide (VIP) interneurons, microglia (Mic), astrocytes (Astro), oligodendrocyte precursor cells (OPCs), oligodendrocytes (Oligo) and vascular cells. c, Vascular cells were annotated using in silico enrichment as endothelial cells (Endo), smooth muscle cells (SMCs), fibroblasts (Fib) and pericytes (Per). d, Differentially expressed genes (DEGs) with 1 h of 40 Hz stimulation versus no stimulation for each cell type. e, DEGs per cell type based on fold-change difference with stimulation. f, Example confocal z-stack projections of RNA in situ hybridization of the DEG Kcnk1 (magenta) in astrocyte-specific nuclei (Aldoc+, yellow). Dashed white outlines represent the nucleus. Scale bars, 10 μm. g, Quantification of images in f. Imaris was used to identify astrocyte nuclei based on Aldoc expression, and the spots feature was used to quantify the number of Kcnk1 puncta per cell (n = 4 mice per group; each data point represents the mean of Kcnk1+ puncta per Aldoc+ astrocyte from each mouse; data are mean ± s.e.m.; P values by one-way ANOVA followed by Dunnett’s multiple comparison test). h, Example confocal images of AQP4 immunofluorescence in mouse prefrontal cortex. Astrocytic endfeet (magenta) are visualized and ensheath the blood vessel. i, The polarization index of AQP4 (n = 4 (no stimulation), 4 (8 Hz), 4 (40 Hz) and 3 (80 Hz) 6-month-old 5XFAD mice; data are mean ± s.e.m.; P values by one-way ANOVA followed by Dunnett’s multiple comparison test).

