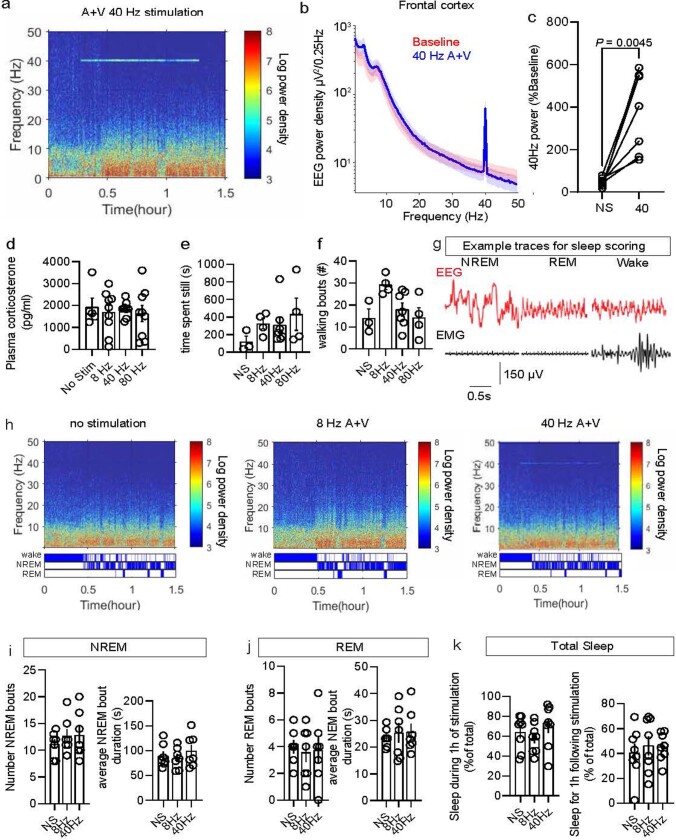
Extended Data Fig. 1. Arousal state following multisensory stimulations in 6-month-old 5XFAD mice.
a. Example spectrogram from frontal EEG signal recorded in one 6-month-old 5XFAD mouse during 40 Hz stimulation (presented between 0.3 h and 1.3 h). b. Mean EEG power density measured in frontal cortex (n = 7 6-month-old 5XFAD mice; data is presented as the mean across all mice; shaded area represents the standard error of the mean). c. Average power at 40 Hz measured in frontal cortex of 6-month-old 5XFAD mice during one hour of audio-visual 40 Hz stimulation compared to baseline period (no stimulation). Values are expressed as % of mean power density during baseline (no stimulation) (n = 7 6-month-old 5XFAD mice; data is presented as the mean ± s.e.m.; P value was calculated by paired two-tailed t-test). d. Plasma corticosterone measured by ELISA following 1 h of multisensory stimulation (either 8 Hz, 40 Hz, or 80 Hz multisensory stimulation or no stimulation) in 6-month-old 5XFAD mice (n = 5 mice for no stimulation; 9 mice for 8 Hz; 9 mice for 40 Hz; 9 mice for 80 Hz; data is presented as the mean ± s.e.m.; statistical analysis used one-way ANOVA followed by Tukey’s multiple comparisons test). e. Time spent still (seconds) during 1 h of multisensory stimulation (either no stimulation, 8 Hz, 40 Hz, or 80 Hz multisensory stimulation) in 6-month-old 5XFAD mice (n = 3 mice for no stimulation (NS); 4 mice for 8 Hz; 7 mice for 40 Hz; 4 mice for 80 Hz; data is presented as the mean ± s.e.m.; one-way ANOVA followed by Tukey’s multiple comparisons test was used for statistical analysis). f. Number of walking bouts during 1 h of multisensory stimulation (either no stimulation, 8 Hz, 40 Hz, or 80 Hz multisensory stimulation) in 6-month-old 5XFAD mice (n = 3 mice for no stimulation (NS); 4 mice for 8 Hz; 7 mice for 40 Hz; 4 mice for 80 Hz; data is presented as the mean ± s.e.m.; one-way ANOVA followed by Tukey’s multiple comparisons test was used for statistical analysis). g. Representative EEG traces (recorded from the frontal cortex) and the EMG (recorded from the neck muscle) during NREM, REM and wake in one mouse using established methods54. h. Representative spectrograms (top) and hypnogram (bottom) for each stimulation condition in one mouse. The top bar of the hypnogram represents the time spent wake, middle bar represents NREM state, and bottom bar represents REM state. i. Quantification of NREM bouts (left) and average NREM bout duration (right) across stimulation conditions (no stimulation; 8 Hz; or 40 Hz) (n = 7 6-month-old 5XFAD mice; repeated measures paired one-way ANOVA followed by Tukey’s multiple comparisons test was used for statistical analysis; data is presented as the mean ± s.e.m.). j. Quantification of REM bouts (left) and average REM bout duration (right) across stimulation conditions (no stimulation; 8 Hz; or 40 Hz) (n = 7 6-month-old 5XFAD mice; repeated measures paired one-way ANOVA followed by Tukey’s multiple comparisons test was used for statistical analysis; data is presented as the mean ± s.e.m.). k. Quantification of total sleep during (left) and 1 h after (right) stimulation (No stimulation (NS), 8 Hz audio-visual, 40 Hz audio-visual stimulation) as a percent of total time (n = 8 6-month-old 5XFAD mice; repeated measures paired one-way ANOVA followed by Tukey’s multiple comparisons test was used for statistical analysis; data is presented as the mean ± s.e.m.).

