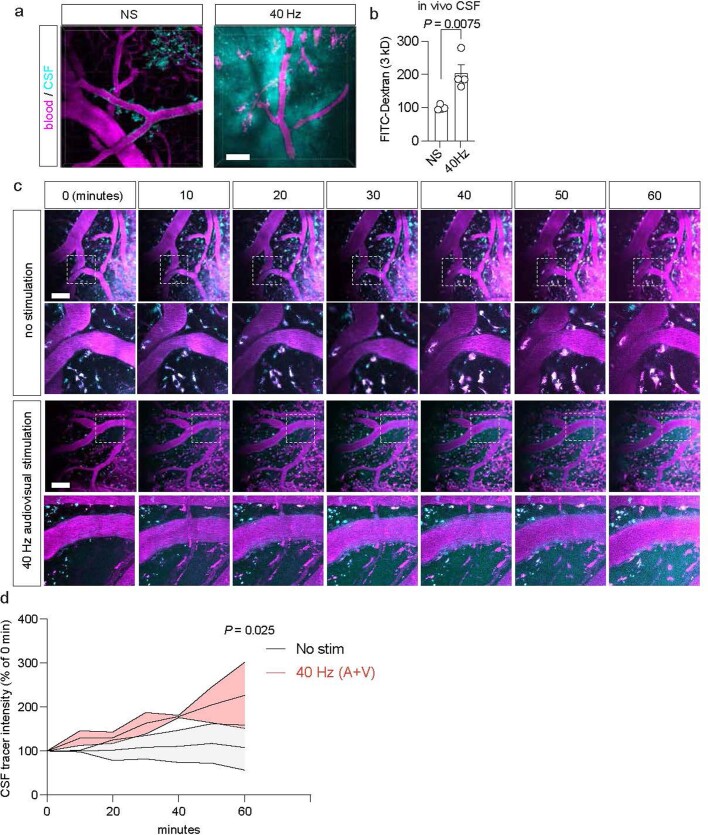
Extended Data Fig. 2. Monitoring CSF dynamics following multisensory 40 Hz stimulation via two-photon microscopy in awake 6-month-old 5XFAD mice.
a. Example 2 P z-stacks of vascular blood (magenta, Texas Red-Dextran-70kD, injected retro-orbitally) and CSF tracer (cyan, FITC-Dextran-3kD, infused through a cannula installed into the cisterna magna) following 1 h of multisensory gamma stimulation or no stimulation control, imaged via a cranial window in frontal cortex. Scale bar, 50 μm. b. Quantification of CSF tracer (FITC-Dextran-3kD) infused via intracisternal cannulation into 6-month-old 5XFAD mouse cortex via 2 P microscopy. The intensity of tracer signal was quantified using ImageJ (n = 4 mice per condition; each data point represents the mean of at least two z-stacks per mouse; data is presented as the mean ± s.e.m.; P value represents unpaired two-sided t-test). c. Example 2 P z-stacks imaged every 10 min after no stimulation or 40 Hz stimulation. Images are representative of two separate experiments. Scale bar, 100 um. d. Quantification of CSF tracer dynamics (n = 2 6-month-old 5XFAD mice per group; P value by two-way ANOVA followed by Fisher’s LSD test).

