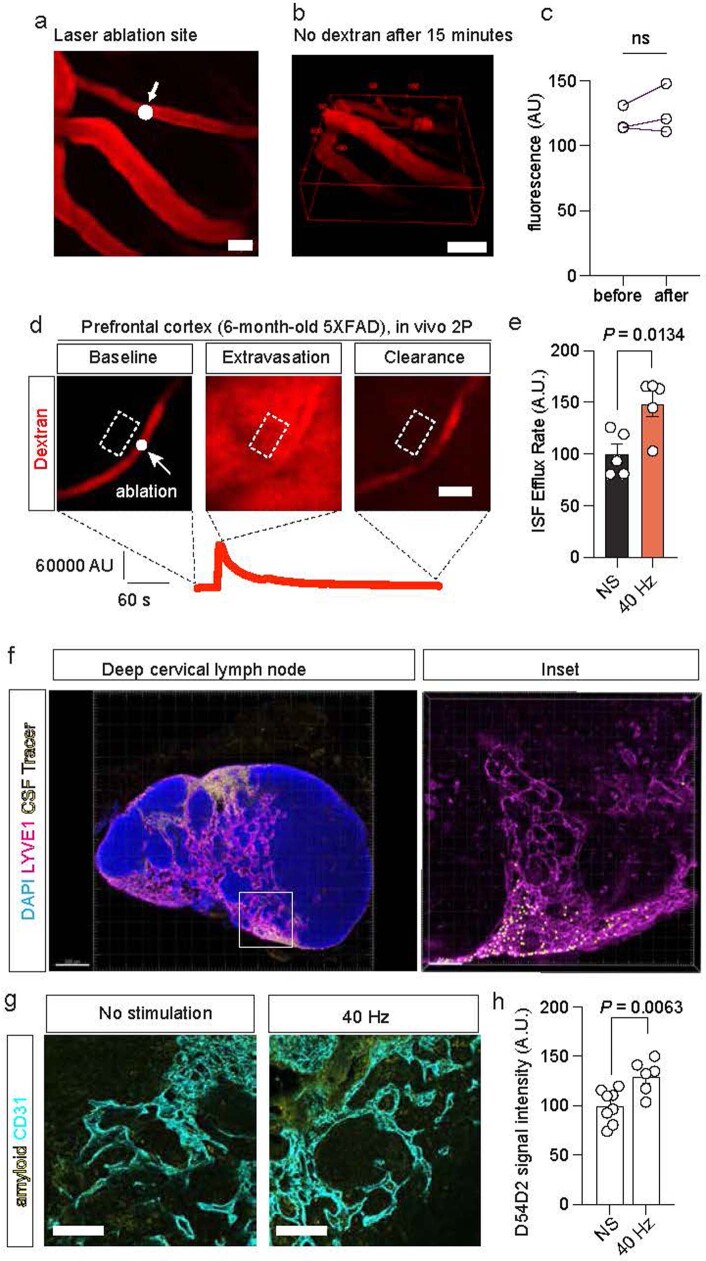
Extended Data Fig. 3. Clearance assays following gamma stimulation.
a. The white dot marks the representative position of a 2P-laser ablation applied to a vascular segment, to induce brief extravasation of intravenously loaded dextran (Texas Red-Dextran-70kD). Scale bar, 20 μm. b. Representative volumetric scan of Texas Red-Dextran-70kD in mouse PFC 15 min after application of the laser ablation, suggesting extravasated tracer is cleared within 15 min. c. Quantification of extravascular fluorescence before and after ISF ablation assay (n = 3 regions of interest from 1 6-month-old 5XFAD mouse; two-tailed unpaired t-test was used for statistical analysis). Scale bar, 50 um. d. Example images of 2 P focal ablation assay showing clearance of extravasated material due to interstitial fluid flux in 6-month-old 5XFAD mice. The white dot (left panel) marks the representative position of a 2P-laser ablation applied to a vascular segment, inducing extravasation of intravenously loaded dextran (Texas Red-Dextran-70kD; middle panel) that is then quickly cleared from the brain parenchyma (right panel; scale bar, 10 μm). The red graph under the panel shows the Texas Red fluorescence intensity in the region surrounded by the dotted box over time. e. Quantification of interstitial fluid efflux in 6-month-old 5XFAD mice following 1 h of multisensory gamma stimulation or non-stimulated control (n = 5 6-month-old 5XFAD mice per stimulation condition; each mouse was imaged in 3 vessel segments; data is presented as the mean ± s.e.m.; P value by unpaired two-tailed student’s t-test). f. Example confocal image of lymph node following infusion of FluoSphere beads to the cisterna magna. Inset reveals beads in LVYE+ area. Scale bar, 200 μm. This experiment was performed once. g. Example confocal z-stack projections of endothelial cells (CD31, cyan) and amyloid (D54D2, yellow) in deep cervical lymph nodes from 6-month-old 5XFAD mice receiving 1 h of multisensory gamma stimulation or no stimulation. Scale bar. h. Quantification of amyloid in deep cervical lymph nodes in 6-month-old 5XFAD mice after no stimulation (NS) or 1 h of 40 Hz stimulation (n = 8 mice for no stimulation and 7 mice for 40 Hz stimulation; each data point represents the mean signal intensity from confocal z-stacks acquired from at least three lymph nodes from each mouse; data is presented as the mean ± s.e.m.; P value calculated by unpaired two-tailed student’s t-test).

