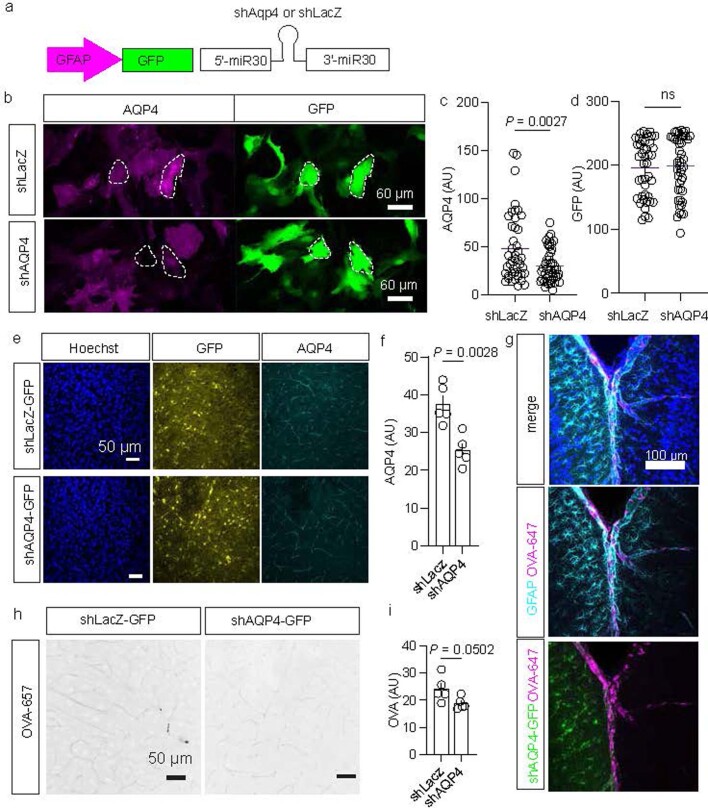
Extended Data Fig. 5. shAQP4 strategy to attenuate AQP4 function.
a. miR-30 based shRNA strategy to reduce AQP4. Constructs target the coding region of AQP4 or, as a control, LacZ. Constructs targeting three different regions of AQP4 were packaged into individual AAVs and then pooled for injection. b. Example confocal z-stack maximum intensity projections of mouse primary astrocyte cultures showing AQP4 signal (magenta) and GFP (green) following AAV application delivering shAQP4 or shLacZ. c. Quantification of AQP4 signal intensity (n = 43 cells for shLacZ, n = 46 cells for shAQP4; data is presented as the mean ± s.e.m; P value calculated by unpaired two-tailed student’s t-test). d. Quantification of GFP signal intensity (n = 43 cells for shLacZ, n = 46 cells for shAQP4; data is presented as the mean ± s.e.m; unpaired two-tailed student’s t-test was used for statistical analysis). e. Example confocal z-stack maximum intensity projections of mouse cortex following 4 weeks of viral injection (AAV-GFAP-shLacZ or AV-GFAP-shAQP4-GFP). Immunostaining shows Hoechst (blue), AQP4 signal (cyan) and GFP (yellow). Scale bar, 50 um. f. Quantification of AQP4 signal intensity from z-stacks. (n = 5 3-month-old C57BL/6 J mice for shLacZ and 5 mice for shAQP4; data is presented as the mean ± s.e.m; P value calculated by unpaired two-tailed student’s t-test). g. Example confocal z-stack maximum intensity projections of 3-month-old C57BL/6 J mouse cortex following 4 weeks of viral injection (AAV-GFAP-shLacZ or AV-GFAP-shAQP4-GFP) followed by OVA-647 injection to the cisterna magna. Immunostaining shows Hoechst (blue), GFP signal (green) and OVA-647 CSF tracer (magenta). This experiment was performed twice. Scale bar, 50 um. h. Example confocal z-stack maximum intensity projections of mouse cortex of OVA-47 (black). i. Quantification of OVA CSF tracer in mouse cortex after shLacZ or shAQP4 (n = 5 mice for shLacZ and 5 mice for shAQP4; data is presented as the mean ± s.e.m; P value calculated by unpaired two-tailed student’s t-test).

