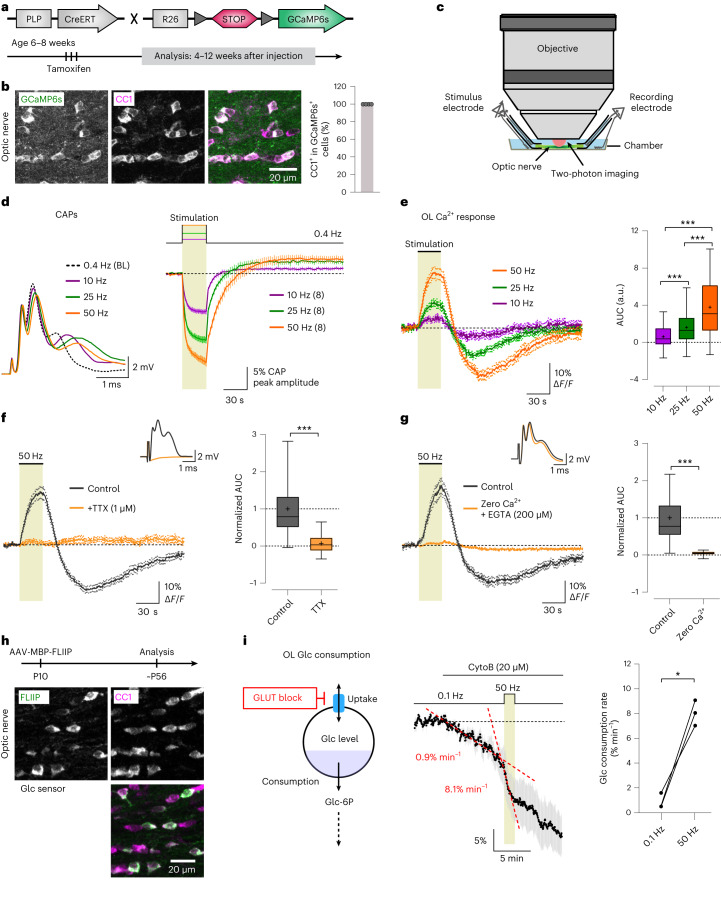
Fig. 1. Axonal activity-induced Ca2+ signaling and glycolytic flux in optic nerve OLs.
a, Generation and tamoxifen treatment of PLP-CreERT;RCL-GCaMP6s mice at 6–8 weeks; experiments were performed 4–12 weeks after injection. b, Left, immunohistochemistry images of GCaMP6s expression in OLs (anti-green fluorescent protein (anti-GFP) antibody, green; anti-CC1 antibody, magenta). Right, percentage of GCaMP6s-positive cells that are also positive for CC1 (n = 4 mice, gray circles). c, Optic nerve preparation for electrophysiology and imaging. d, Left, example CAPs at 0.4 Hz (baseline (BL)) and after 30-s stimulation at 10, 25 or 50 Hz. Right, time course (mean ± s.e.m.) of CAP peak 2 amplitude relative to baseline (n = 8 mice). e, Left, OL Ca2+ responses (mean ± s.e.m.) to different axonal stimulations. Right, box plots showing the response area under the curve (AUC; n = 108 cells from eight mice). Higher frequencies induced larger Ca2+ surges (50 versus 25 Hz, ***P < 0.0001; 50 versus 10 Hz, ***P < 0.0001; 25 versus 10 Hz, ***P < 0.0001; one-way analysis of variance (ANOVA), Tukey’s multiple-comparison test). f, Left, TTX (1 μM) abolished the 50-Hz-induced OL Ca2+ response. Inset, CAP diminished by TTX. Right, normalized response AUCs before and after TTX (n = 82 cells from six mice), showing a reduction by 93 ± 9% (***P < 0.0001, two-sided paired t test). g, Left, removal of extracellular Ca2+ (+200 μM EGTA) diminished the OL Ca2+ response.Inset, CAP response in zero Ca2+. Right, normalized response AUCs showing a 96 ± 14% reduction (n = 44 cells from three mice, ***P < 0.0001, two-sided paired t test). h, AAV-mediated glucose (Glc) FRET sensor (FLIIP) expression in adult optic nerve OLs following intracerebroventricular injection. Immunostaining with CC1 (magenta) confirmed FLIIP expression (anti-GFP antibody, green) in mature OLs (observed in three mice). MBP, myelin basic protein; P10, postnatal day 10; ∼P56, approximately postnatal day 56. i, Left, schematic of glucose consumption after inhibiting glucose uptake with the glucose transporter (GLUT) blocker CytoB. Glc-6P, glucose 6-phosphate. Middle, time course of glucose decline during CytoB incubation at 0.1 Hz and upon transient 50-Hz stimulation (mean ± s.e.m.). The mean decline rate (red dashed lines) increased from 0.9 ± 0.4% min−1 at 0.1 Hz to 8.1 ± 0.6% min−1 at 50 Hz. Right, graph showing the glucose consumption rates (n = 3 mice, *P = 0.0159, two-sided paired t test). Box plots show the median (center line), quartiles (box bounds), mean (+) and 5th–95th percentiles (whiskers).

