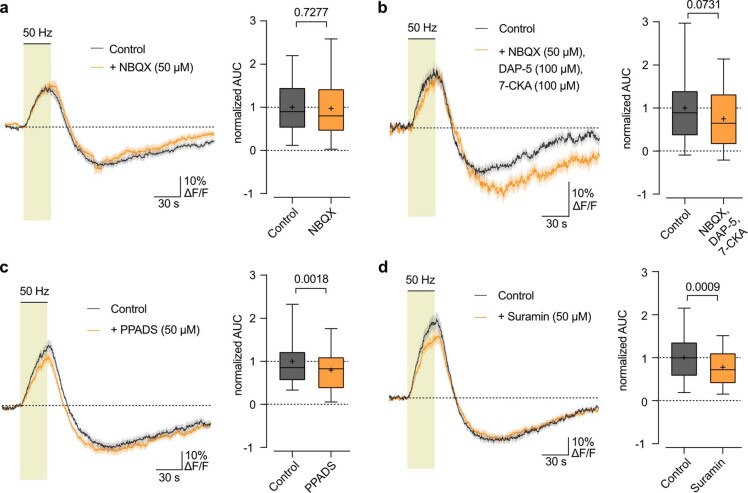
Extended Data Fig. 2. Minor contribution of glutamatergic and purinergic signaling to stimulus-evoked Ca2+ response in OLs.
a, 50 Hz-evoked OL soma Ca2+ changes in control condition and with addition of NBQX (50 µM). Quantification of OL Ca2+ surge (AUC during stimulation period, boxplots) revealed no difference in the stimulus-evoked Ca2+ increase (n = 45 cells from 3 mice, p = 0.7277, two-sided paired t-test). b, OL Ca2+ changes with NBQX (50 µM), DAP-5 (100 µM), and 7-CKA (100 µM) revealed a decrease in the stimulus-evoked Ca2+ increase by 25 ± 13% (n = 33 cells from 3 mice, p = 0.0732, two-sided paired t-test). c, OL Ca2+ response with PPADS (50 µM) revealed a decrease in the stimulus-evoked Ca2+ increase by 21 ± 6% (n = 46 cells from 3 mice, p = 0.0018, two-sided paired t-test). d, OL Ca2+ response with Suramin (50 µM) revealed a decrease in the stimulus-evoked Ca2+ increase by 22 ± 6% (n = 33 cells from 2 mice, p = 0.0009, two-sided paired t-test). Traces represent mean ± SEM. Boxplots show median (line), quartiles (box bounds), mean (+), and 5-95 percentiles (whiskers).

