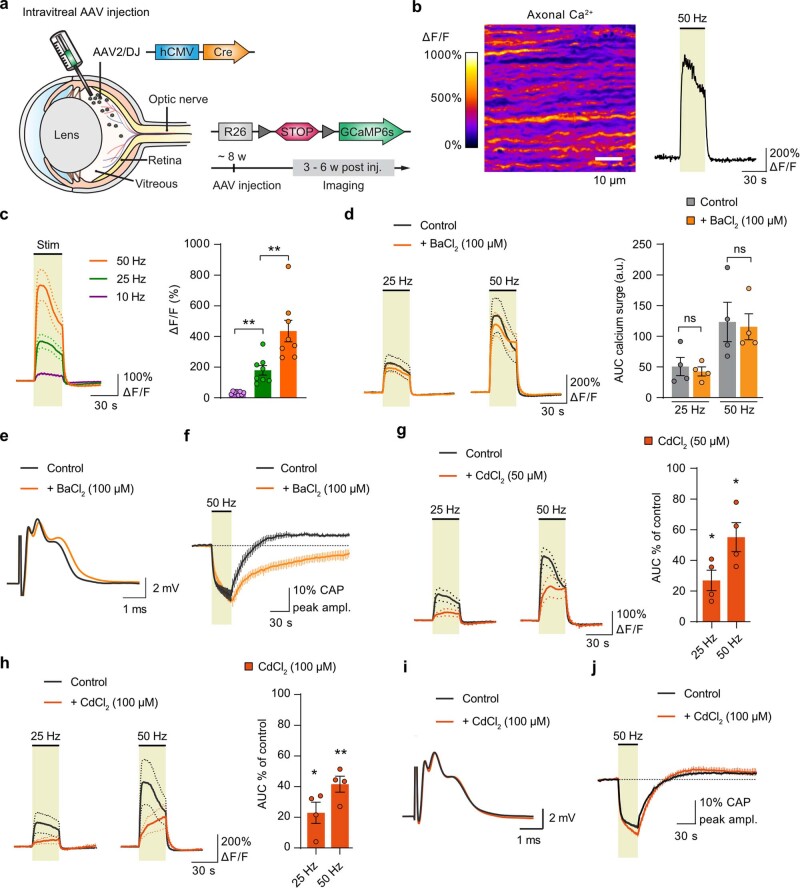
Extended Data Fig. 3. Stimulus-evoked axonal Ca2+ surge not sensitive to barium.
a, Intravitreal AAV-Cre injection into ∼8 weeks old RCL-GCaMP6s mice drives GCaMP6s expression in optic nerve axons and used for two-photon imaging. b, Electrical 50 Hz stimulation triggers Ca2+ rise in axons. Depicted is an example recording of a 30 s stimulation, with ΔF/F image (left) and corresponding Ca2+ trace. c, Stimulus-evoked axonal Ca2+ transients are significantly larger with higher stimulation frequencies (n = 8 mice; 10 Hz vs 25 Hz, p = 0.0027; 25 Hz vs 50 Hz, p = 0.0013; one-way ANOVA with Tukey’s multiple comparisons test). d, Stimulus-evoked axonal Ca2+ surge is not affected by application of 100 µM Ba2+, tested at 25 Hz (n = 4 mice, p = 0.49, two-sided paired t-test) and 50 Hz (n = 4, p = 0.6859, two-sided paired t-test). e, Example CAP trace in control conditions and with addition of 100 µM Ba2+. f, Time course of CAP peak amplitude changes upon 50 Hz stimulations. Note that the recovery kinetics of the peak amplitude are strongly reduced in the presence of Ba2+ compared to control (n = 4 mice, Finteraction (74, 444) = 2.487, p < 0.0001, two-way ANOVA). g and h, Inhibition of VGCCs with Cd2+ significantly reduced the stimulus-evoked axonal Ca2+ surge. At 50 µM Cd2+ (g) the 25 Hz- and 50 Hz-evoked Ca2+ surges were reduced to 27 ± 7% (n = 4 mice; p = 0.0133, two-sided paired t-test) and to 55 ± 9% (n = 4 mice; p = 0.0343, two-sided paired t-test), respectively. At 100 µM Cd2+ (h) the 25 Hz- and 50 Hz-evoked Ca2+ surges were reduced to 23 ± 7% (n = 4 mice; p = 0.0402, two-sided paired t-test) and by 42 ± 5% (n = 4 mice; p = 0.0074, two-sided paired t-test), respectively. i, Example CAP trace in control conditions and with addition of 50 µM Cd2+. j, CAP recovery kinetics after 50 Hz stimulation is not affected by Cd2+ (n = 4 mice). Data are represented as mean time traces ± SEM and as dot-plots with means ± SEM.

