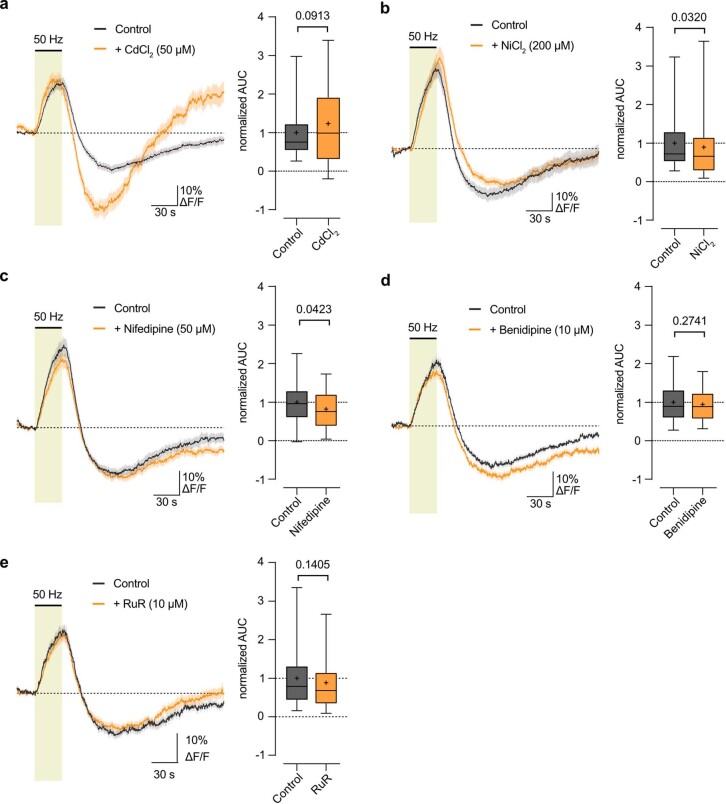
Extended Data Fig. 4. Voltage-gated Ca2+ channels are no major drivers of stimulus-evoked OL Ca2+ response.
a, OL Ca2+ response in control condition and with Cd2+ (50 µM) revealed a slight increase in the 50 Hz-evoked Ca2+ rise (n = 54 cells from 4 mice, p = 0.0913 two-sided paired t-test). b, OL Ca2+ response with Ni2+ (200 µM) revealed a slight decrease in the 50 Hz-evoked Ca2+ surge by 11 ± 5% (n = 60 cells from 4 mice, p = 0.0320 two-sided paired t-test). c, OL Ca2+ response with Nifedipine (50 µM) revealed a slight decrease in the 50 Hz-evoked Ca2+ surge by 18 ± 9% (n = 39 cells from 3 mice, p = 0.0423 two-sided paired t-test). d, OL Ca2+ response with Benidipine (10 µM) revealed no overt change in the 50 Hz-evoked Ca2+ surge (n = 56 cells from 3 mice, p = 0.2741 two-sided paired t-test). e, OL Ca2+ response with RuR (10 µM) revealed no significant changes in the 50 Hz-evoked Ca2+ surge (n = 71 cells from 4 mice, p = 0.1405 two-sided paired t-test). Traces represent mean ± SEM. Boxplots show median (line), quartiles (box bounds), mean (+), and 5-95 percentiles (whiskers).

