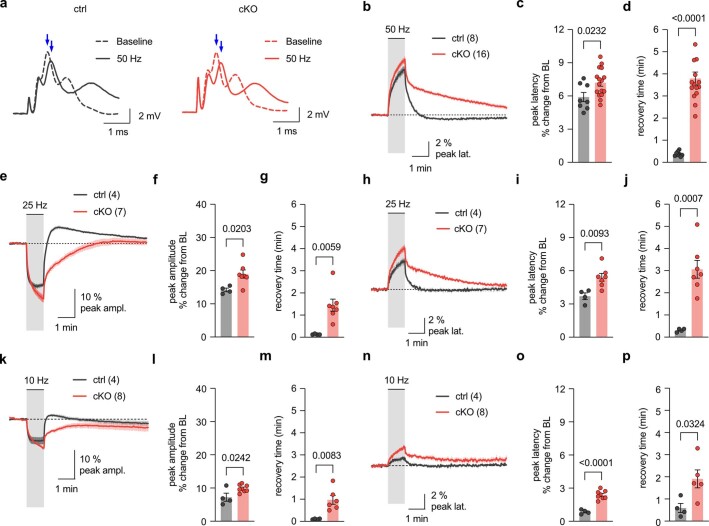
Extended Data Fig. 7. Altered CAP peak latency recovery kinetics in Kir4.1 cKO.
a, Representative CAP traces of ctrl and cKO at baseline and post 50 Hz stimulus train, highlighting changes in CAP peak amplitude and latency (blue arrows). b-d, Analysis of CAP peak latency changes to 1 min 50 Hz in ctrl (n = 8 mice) and cKO (n = 16 mice): b, Average % changes (± SEM) from baseline in CAP peak latency showing slower recovery in cKO. c, CAP peak latency analysis at the end the stimulation revealing larger increase in latency in cKO compared to ctrl (p = 0.0232, two-sided Student’s t-test). d, Analysis of CAP peak latency recovery time post stimulation, significantly slower in cKO compared to ctrl (p < 0.0001, two-sided Student’s t-test). e-j, 25 Hz-induced CAP changes in ctrl (n = 4 mice) and cKO (n = 7 mice). e-g: CAP peak amplitude: e, Average % changes in peak amplitude. f, Greater decrease in cKO (p = 0.0203, two-sided Student’s t-test). g, Slower recovery post-stimulation in cKO (p = 0.0059, two-sided Student’s t-test). h-j, CAP peak latency: h, Average % changes in latency. i, Larger increase in cKO mice (p = 0.0093, two-sided Student’s t-test). j, Slower recovery post-stimulation in cKO (p = 0.0007, two-sided Student’s t-test). k-p, 10 Hz-induced CAP changes in ctrl (n = 4 mice) and cKO (n = 8 mice). k-m, CAP peak amplitude: k, Average % changes in peak amplitude. l, Greater decrease in cKO mice (p = 0.0242, two-sided Student’s t-test). m, Slower recovery post-stimulation in cKO (p = 0.0083, two-sided Student’s t-test). n-p, CAP peak latency: n, Average % changes in latency. o, Larger increase in cKO mice (p < 0.0001, two-sided Student’s t-test). p, Slower recovery post-stimulation in cKO (p = 0.0324, two-sided Student’s t-test). Data are represented as dot-plots with means ± SEM.

