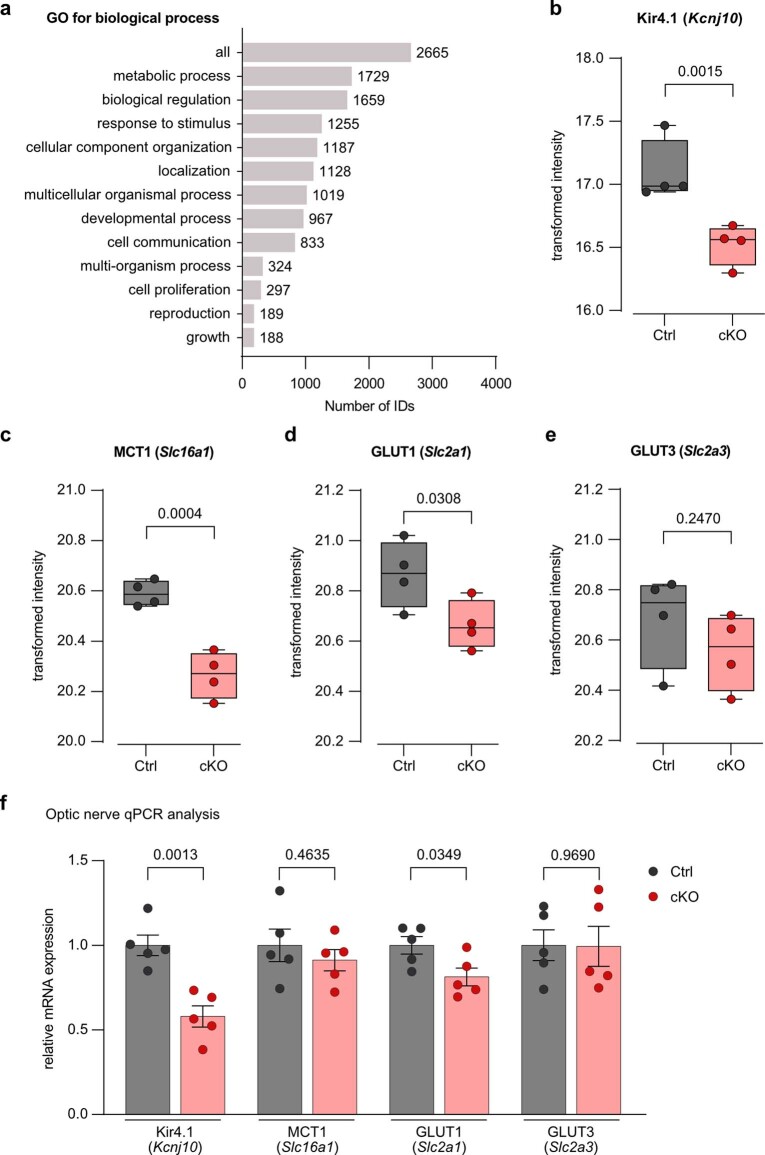
Extended Data Fig. 9. Proteomics and qPCR analysis of optic nerve lysates from young Kir4.1 cKO mice.
a, Of the 3624 detected protein hits from the TMT-based proteomics analysis (see Fig. 4), 2665 were unambiguously mapped to unique Entrez gene IDs. Using the GO term biological process, bar charts depict the GO annotation and functional categorization of identified proteins. WebGestalt.org provided the summary. b, Protein abundance of Kir4.1 (gene Kcnj10) is reduced in samples from cKO (n = 4 mice) compared to ctrl (n = 4, p = 0.0015, moderated t-test). c, Abundance of MCT1 (Slc16a1) is reduced in cKO compared to ctrl (n = 4, p = 0.0004, moderated t-test). d, Abundance of GLUT1 (Slc2a1) is reduced in cKO compared to ctrl (n = 4, p = 0.0308, moderated t-test). e, Abundance of GLUT3 (Slc2a3) is unchanged between genotypes (n = 4, p = 0.2470, moderated t-test). Boxplots with all points show median (line), quartiles (box bounds), and min to max (whiskers). f, Relative mRNA abundance in optic nerve lysates of 3-months-old cKO (n = 5) and littermate ctrls (n = 5): Compared to ctrl, Kir4.1 mRNA levels were reduced by 0.42 ± 0.09 (p = 0.0013, two-sided Student’s t-test) and GLUT1 mRNA levels were reduced by 0.19 ± 0.07 (p = 0.0349, two-sided Student’s t-test). No significant differences in mRNA levels of MCT1 (p = 0.4635) and GLUT3 (p = 0.9690). Data represented as dot-plots with means ± SEM.

