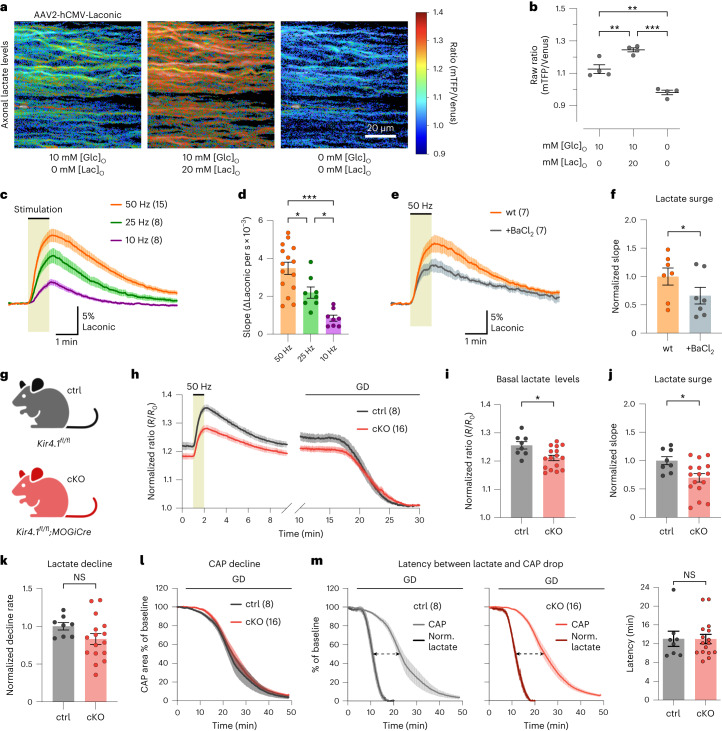
Fig. 3. Axonal lactate dynamics are regulated by oligodendroglial Kir4.1.
a, Lactate FRET sensor (Laconic) expression in optic nerve axons through intravitreal AAV delivery in wild-type mice. Color-coded ratio images in ACSF with 10 mM glucose, additional 20 mM lactate (Lac), and after glucose and lactate removal. hCMV, human cytomegalovirus; mTFP, monomeric teal fluorescent protein. b, Ratio quantification of conditions in a, confirming the sensor’s response to lactate availability (n = 4 mice; [glucose]/[lactate] in mM: 10/0 versus 10/20: **P = 0.0052; 10/0 versus 0/0: **P = 0.0014; 10/20 versus 0/0: ***P < 0.0001; one-way ANOVA Holm–Šídák’s multiple-comparison test). c, Lactate level changes (%) upon 10-Hz (n = 8 mice), 25-Hz (n = 8 mice) or 50-Hz (n = 15 mice) stimulation. d, Lactate surges (initial slopes), showing higher lactate increases at higher frequencies (50 Hz, n = 15 mice; 25 Hz, n = 8 mice; 10 Hz, n = 8 mice; 50 versus 25 Hz, *P = 0.0141; 50 versus 10 Hz, ***P < 0.0001; 25 versus 10 Hz, *P = 0.0141; one-way ANOVA with Holm–Šídák’s multiple-comparison test). e,f, Ba2+ (100 μM) reduced the 50-Hz-induced axonal lactate increase (e) by 34 ± 11% (f) (n = 7, two-sided paired t test, *P = 0.0249). wt, wild type. g, OL-specific Kir4.1 cKO (Kir4.1fl/fl;MOGiCre) and control (ctrl) mice (Kir4.1fl/fl). h–m, Axonal lactate and CAP analyses in ∼3-month-old cKO (n = 16) and control (n = 8) mice. h, Time course of axonal lactate levels during 50-Hz stimulation and GD. Traces were normalized to the minimum level after GD. i, Basal axonal lactate levels were lower in cKO versus control (*P = 0.0119, two-sided unpaired t test). j, 50-Hz-evoked lactate surge was lower in cKO (*P = 0.0174, two-sided unpaired t test). k, Lactate decline rate during GD was similar between genotypes (P = 0.1318, two-sided unpaired t test). l, CAP decline kinetics during GD were comparable between genotypes (CAP decline slope: P = 0.7934, time to 50% CAP area: P = 0.7265, two-sided unpaired t test). m, Normalized (Norm.) axonal lactate and CAP time traces during GD in control (left) and cKO (middle) mice. Right, graph showing that the temporal delay between 50% lactate decline and CAP drop (dashed arrows in left and middle) was similar between genotypes (P = 0.9789, two-sided unpaired t test). Data are represented as mean ± s.e.m.

