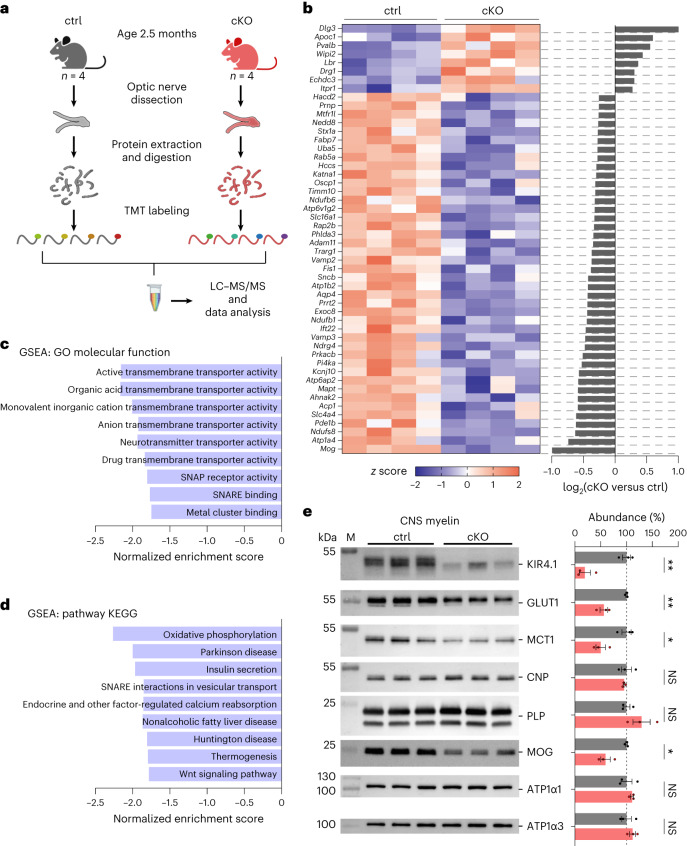
Fig. 4. MCT1 and GLUT1 levels are reduced in central nervous system myelin of Kir4.1 cKO mice.
a, TMT-based proteomics analysis in optic nerves from 2.5-month-old Kir4.1 cKO (n = 4) and littermate control (n = 4) mice. The scheme (generated by BioRender) shows extraction, digestion, TMT labeling and pooling for liquid chromatography–tandem mass spectrometry (LC–MS/MS). b, Top 50 (sorted by FDR) differentially regulated proteins listed with gene names. The heat map shows upregulation (red) or downregulation (blue) in cKO versus control ranked by log2(fold change), including only proteins with fold change >0.25 or <−0.25. Row z scores were calculated from normalized intensities. c,d, Gene set enrichment analyses (GSEAs) for the categories Gene Ontology (GO) molecular function (c) and pathway Kyoto Encyclopedia of Genes and Genomes (KEGG) (d) showed decreases in transmembrane transporter activity, vesicular transport and energy metabolism (FDR < 0.05). Analysis was performed through WebGestalt.org, with proteins ranked by log2(fold change). SNAP, soluble N-ethylmaleimide-sensitive factor attachment protein; SNARE, SNAP receptor. e, Left, immunoblot analysis of Kir4.1, MCT1 and GLUT1 in myelin biochemically purified from the brains of 2.5-month-old control (n = 3) and cKO (n = 3) mice. M, molecular weight marker. Right, compared to controls (gray), cKO mice (red) showed a reduced abundance of Kir4.1 by 81 ± 13% (**P = 0.0038), GLUT1 by 44 ± 8% (**P = 0.0044) and MCT1 by 50 ± 13% (*P = 0.0179, two-sided unpaired t test). Known myelin proteins PLP, 2′,3′-cyclic nucleotide 3′-phosphodiesterase (CNP), myelin oligodendrocyte glycoprotein (MOG), ATPase Na+/K+ transporting subunit α1 (ATP1α1) and ATP1α3 were detected as markers. Note that the MOG abundance was reduced by 40 ± 9% (*P = 0.0125, two-sided unpaired t test), attributed to Cre insertion under the MOG promoter in heterozygous MOGiCre mice inactivating one mog allele. Data are represented as mean ± s.e.m.

