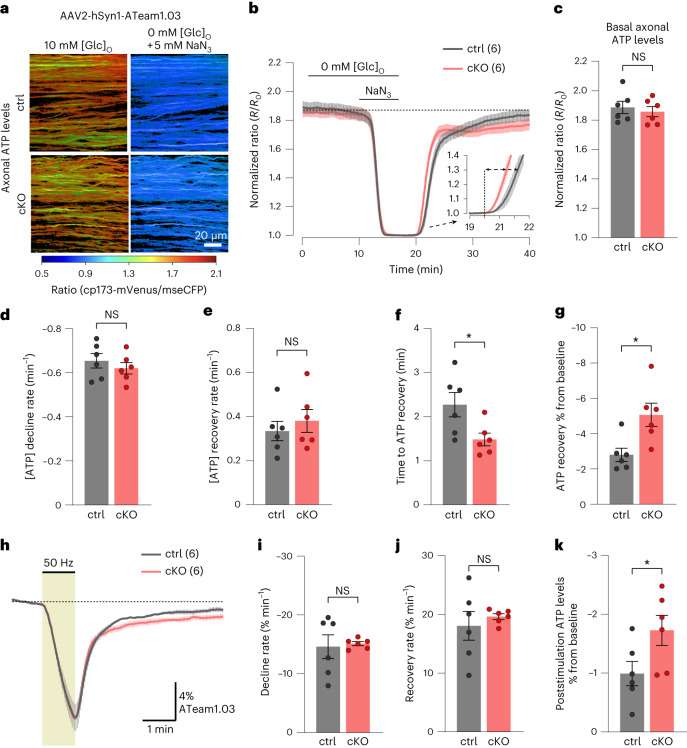
Fig. 5. Minor changes in axonal ATP dynamics in the absence of oligodendroglial Kir4.1.
a, AAV-mediated ATP FRET sensor (ATeam1.03) expression in optic nerve axons. Color-coded ratio images from control (top) and cKO (bottom) nerves show ATP levels in ACSF with 10 mM glucose and after GD + MI with 5 mM NaN3. hSyn1, human synapsin 1; mseCFP, monomeric superenhanced cyan fluorescent protein. b, Time course of axonal ATP levels in ∼3-month-old cKO (n = 6) and control (n = 6) mice challenged with GD + MI, normalized to the minimum ATP level (R0). Inset, initial ATP recovery dynamics following reperfusion with 10 mM glucose. c, Basal axonal ATP levels were comparable between genotypes (n = 6 mice, P = 0.61, two-sided unpaired t test). d, No difference in the ATP decline rate between genotypes upon GD + MI (n = 6 mice, P = 0.44, two-sided unpaired t test). e, Similar initial ATP recovery rates between genotypes after GD + MI (n = 6 mice, P = 0.51, two-sided unpaired t test). f, Onset of ATP recovery (see dashed arrows in inset in b) differed between control and cKO nerves (n = 6 mice, *P = 0.03, two-sided unpaired t test). g, Lower axonal ATP level recovery in cKO than in controls following GD + MI (n = 6 mice, *P = 0.0135, two-sided unpaired t test). h, Axonal ATP level changes (%) at 50-Hz stimulation relative to baseline. i,j, Similar ATP level decline rates (i) during 50-Hz stimulation (n = 6 mice, P = 0.81, two-sided unpaired t test) and equal initial ATP recovery rates (j) after stimulation (P = 0.54, two-sided unpaired t test). k, Slightly lower axonal ATP level recovery after stimulation in cKO versus controls (n = 6 mice, *P = 0.0498, two-sided unpaired t test). Data are represented as mean ± s.e.m.

