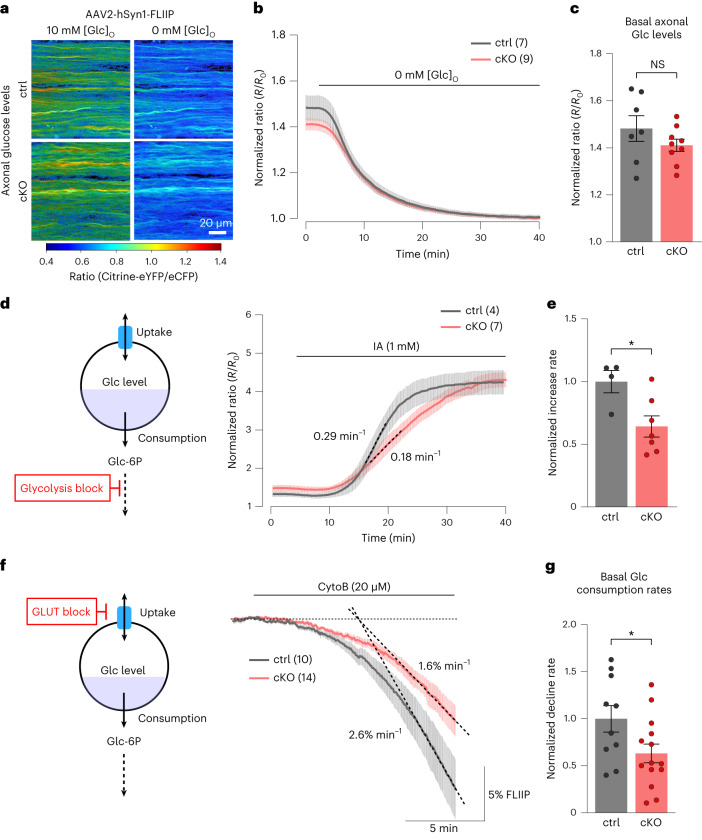
Fig. 6. Lack of oligodendroglial Kir4.1 impairs axonal glucose metabolism.
a, AAV-mediated glucose FRET sensor (FLIIP) expression in optic nerve axons. Color-coded ratio images from control (top) and cKO (bottom) nerves show glucose levels in ACSF with 10 mM glucose and after GD. eYFP, enhanced yellow fluorescent protein; eCFP, enhanced cyan fluorescent protein. b, Time course of axonal glucose levels in ∼3-month-old cKO (n = 9) and control (n = 7) mice during perfusion with regular and zero-glucose ACSF, with 10 mM lactate to sustain CAPs. Traces were normalized to the minimum level after GD. c, Comparable basal axonal glucose levels between genotypes (control n = 7, cKO n = 9, P = 0.2276, two-sided unpaired t test). d,e, Glycolysis inhibition (d, left) with IA (1 mM) in ACSF with 10 mM glucose increased axonal glucose levels (d, right). e, Glucose increase rate (dashed lines in d) upon IA was lower in cKO (n = 7 mice) by 36 ± 13% compared to controls (n = 4 mice; *P = 0.0235, two-sided unpaired t test). f,g, Glucose consumption assessed with CytoB (20 µM) during 0.1-Hz stimulation. f, Scheme (left) and time course (right) of glucose level decline upon CytoB treatment for control (n = 10) and cKO (n = 14) mice, with mean decline rates (dashed lines) of 2.6 ± 0.4% min−1 and 1.6 ± 0.3% min−1, respectively. g, Basal axonal glucose consumption rate in cKO mice (n = 14) was reduced by 37 ± 17% compared to controls (n = 10 mice; *P = 0.0384, two-sided unpaired t test). Data are represented as mean ± s.e.m.

