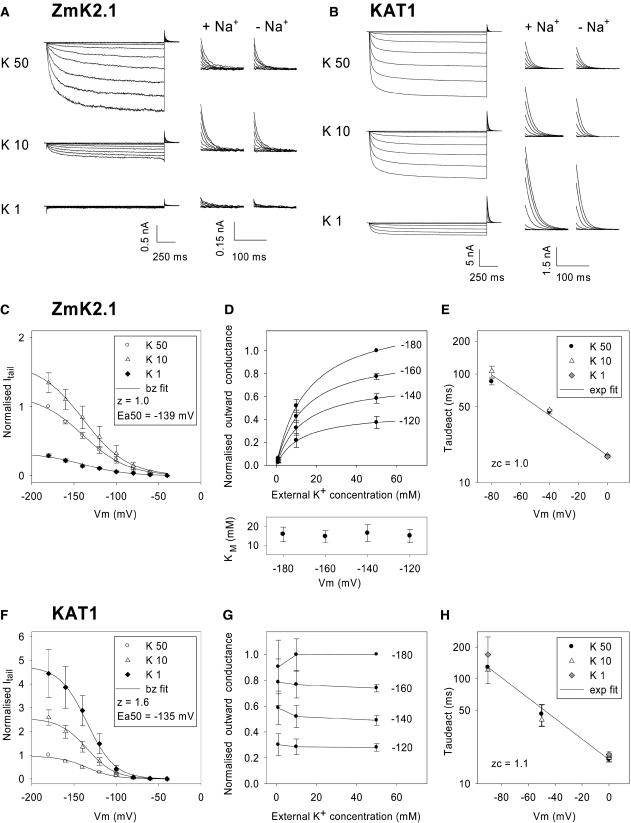
Figure 5.
Effect of External K+ Concentration on ZmK2.1 and KAT1 Activity.
(A) and (B) Current traces recorded in COS cells expressing either ZmK2.1 (A) or KAT1 (B) in the presence of different external K+ concentrations: 50, 10, or 1 mM. The internal K+ concentration was 150 mM. The voltage-clamp protocol consisted of a channel activation step, with applied voltages ranging from −40 to −200 mV, followed by a deactivation step at 0 mV. At left, full traces are shown. The solutions containing 10 or 1 mM K+ were supplemented with 40 or 49 mM NaCl, respectively, for ionic and osmotic strength adjustment. Middle and right, Zoom on deactivation currents recorded at 0 mV after the activation step. In the middle panels (+ Na+), the ionic strength of the bath solutions containing 10 or 1 mM K+ was adjusted with NaCl (as at left). In the right panels (− Na+), no NaCl was added to the bath solutions, the decrease in KCl concentration being compensated for at the osmotic level with mannitol.
(C) to (H) Analysis of ZmK2.1 ([C] to [E]) and KAT1 ([F] to [H]) deactivation currents in the presence of 50, 10, or 1 mM external K+. Na+, N-methyl-d-glucamine, or mannitol was added to compensate for the changes in external K+ concentrations. No difference being observed between the three conditions, the data were pooled. Values shown are means ± se, with n = 6 in (C) to (E) and n = 5 in (F) to (H).
(C) and (F) Deactivation (tail) currents, recorded at 0 mV at 6 ms after the start of the step, plotted against the activation voltage. Deactivation currents were normalized for each cell by the current recorded in 50 mM K+ at −180 mV to suppress current variability caused by differences in cell size and level of expression. Solid lines are Boltzmann (bz) fits.
(D) and (G) Effect of external K+ on the GKout in ZmK2.1 (D) or KAT1 (G). Initial (outward) deactivation currents were assumed to follow the modified Ohm's law (Blatt, 1992; Hille, 1992): I = GK (E – EK), where GK is the macroscopic K+ conductance, E is the membrane potential (here 0 mV), and EK is the K+ equilibrium potential. The GK values were calculated from deactivation currents recorded after activation at −120, −140, −160, or −180 mV. For each cell, the resulting GK values were normalized by the value determined in 50 mM external K+ at −180 mV to suppress variability attributable to differences in cell size and level of expression. For ZmK2.1, normalized GK values plotted versus the external K+ concentration were fitted with a Michaelis-Menten equation for each of the four activation potentials. Resulting apparent Km values are shown at the bottom of (D) (means ± se, n = 5). Solid lines at the top of (D) are mean Michaelis-Menten adjustments (using the mean Km values indicated at bottom).
(E) and (H) Effect of external K+ on the kinetics of current deactivation in ZmK2.1 (E) and KAT1 (H). Deactivation time constants (“Taudeact”; means ± se, n = 6) were obtained from monoexponential fits of deactivation currents recorded at membrane potentials ranging from −90 to 0 mV. Fits of the voltage dependence of deactivation time constants with a monoexponential function (exp fit; solid lines) were used to determine zc, the equivalent charge involved in channel-closing transitions near the open state (Liman et al., 1991).

