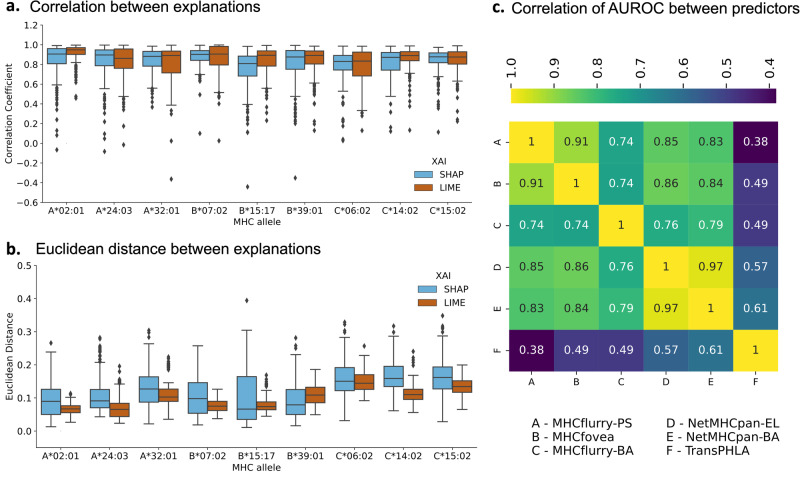
Fig. 6. Testing the consistency of the LIME and SHAP explanations.
a For an input peptide, explanations were generated for MHCflurry-PS and MHCfovea using SHAP and LIME. Pearson correlation coefficients were calculated between these explanations, and the process was repeated for 200 input peptides for each of the alleles presented in the plot. The distribution of Pearson correlation coefficients is closer to one, indicating high similarity between the two explanations for the two predictors on the same input. The correlation coefficient values are reported in Supplementary Data 6. b In addition to the Pearson correlation coefficient, Euclidean distances were calculated between two explanations for two predictors on the same input. For Euclidean distance, values closer to zero indicate high similarity and high consistency. c Correlation heatmap for AUROC scores between investigated MHC class I predictors. MHCflurry-PS and MHCfovea are highly correlated in their performances.

