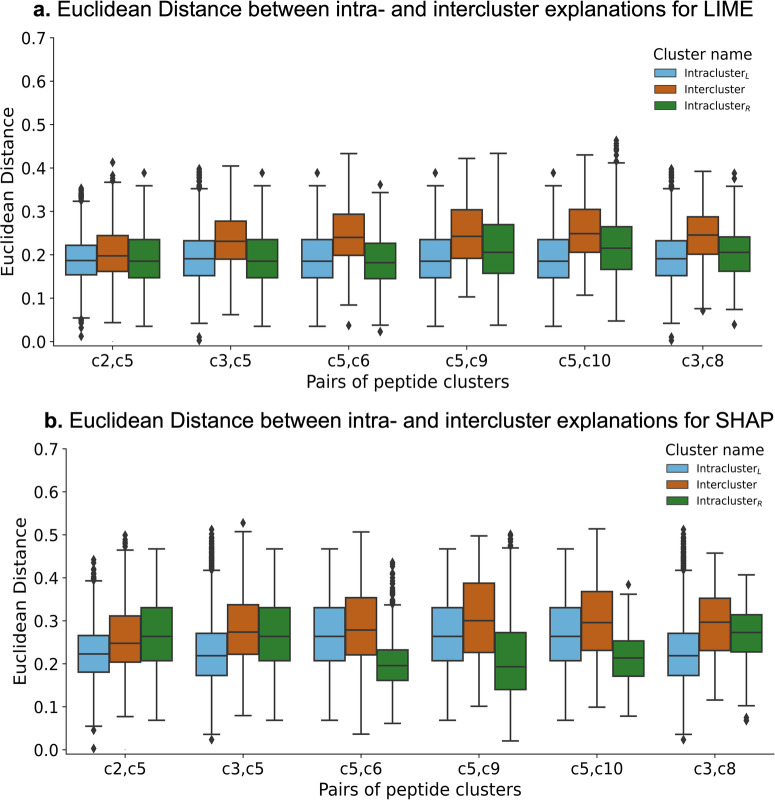
Fig. 7. Testing the stability of the LIME and SHAP explanations.
a Euclidean distance distribution for the top six cluster pairs using LIME. For each pair, there are three distributions - IntraclusterL, Intercluster, and IntraclusterR. For any two pairs (e.g., c2, c5), the intracluster explanation distance distribution for the left cluster (c2) and right cluster (c5) are IntraclusterL and IntraclusterR, while Intercluster is the distribution of explanation distances between the two clusters. b Euclidean distance distribution for the top six cluster pairs using SHAP. For each pair, there are three distributions - IntraclusterL, Intercluster, and IntraclusterR. For any two pairs (e.g., c2, c5), the intracluster explanation distance distribution for the left cluster (c2) and right cluster (c5) are IntraclusterL and IntraclusterR, while Intercluster is the distribution of explanation distances between the two clusters.

