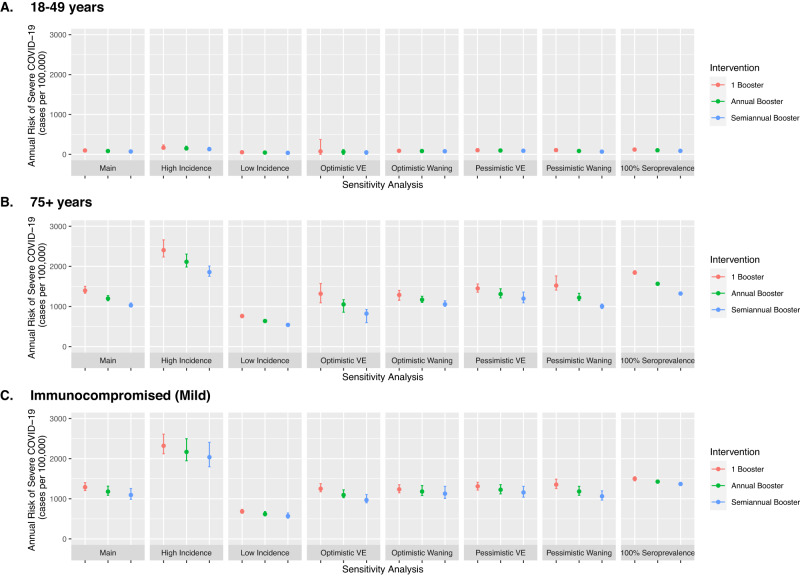
Fig. 3. Sensitivity analysis of model parameters for COVID-19 risk and booster vaccination.
This sensitivity analysis tested alternative model parameters and assumptions on overall vaccine-induced protection (optimistic and pessimistic assumptions), waning of vaccine-induced protection (optimistic and pessimistic assumptions), COVID-19 incidence (0.5x lower or 2x higher) and seroprevalence (100% previously infected). For each sensitivity analysis, we re-calibrated the model and simulated three COVID-19 booster vaccine schedules and plotted annual risk of severe COVID-19. We plotted results for three representative risk groups: 18–49 years (A), 75+ years (B), and the mild immunocompromised population (C). The vertical bars represent uncertainty intervals and capture the full range of varied model parameters (n = 25 simulations per model parameter set), while the point estimate uses base case assumptions of model inputs. Intervals are designed to demonstrate uncertainty within a single vaccine strategy; comparison between vaccine strategies should use the same assumed baseline conditions. Additional risk groups are available in the Appendix (Supplementary Tables S13–S25).

