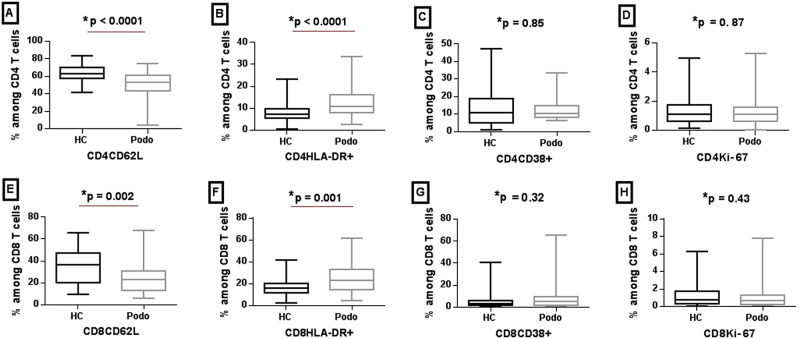
Fig. 1. Median expression of CD62L, HLA-DR, CD38, and Ki-67 markers on CD4 and CD8 T cells from podoconiosis patients and healthy controls.
The figure shows box plots depicting median, interquartile range, minimum and maximum values of subset frequencies positive for CD62L, HLA-DR, CD38, and Ki-67 on CD4 (A–D) and CD8 (E–H) T cells, respectively, in 56 podoconiosis patients (Podo) and 44 healthy controls (HC). *P values were derived using the Mann–Whitney U test of two-sided independent t test. Source data that is used to generate this graph is provided as a “Source Data” file Figs. 1–3.

