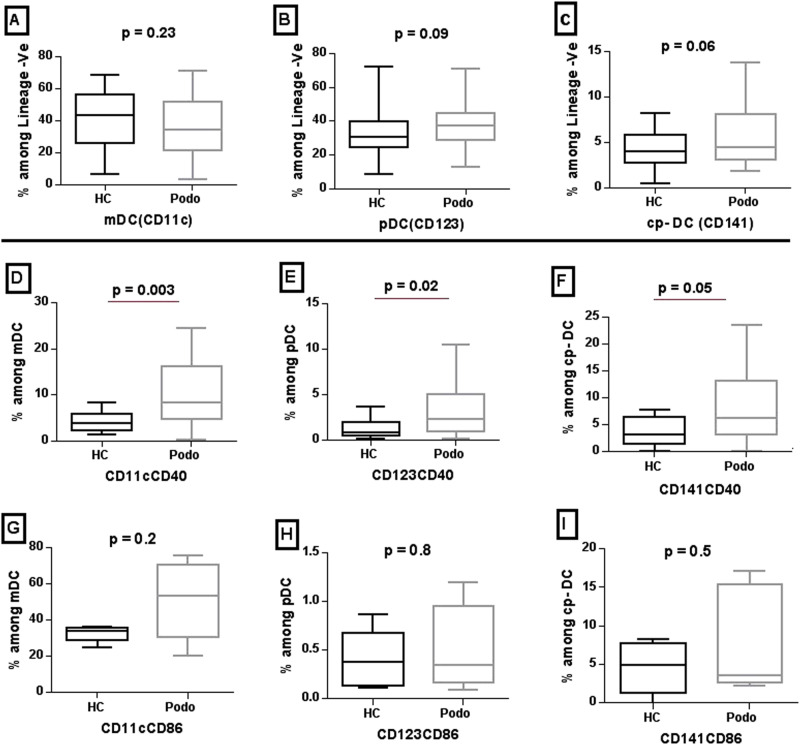
Fig. 3. Proportion of dendritic cell subsets and median expression of CD40 and CD86 markers on the three DC subsets from podoconiosis cases and healthy controls.
Dendritic cell (DC) subsets were sub-enumerated from lineage-negative and HLA-DR positive gated populations; (A myeloid DC, B plasmacytoid DC, and C cross-presenting DC). D–F, G–I shows expression of CD40 and CD86 markers among these DC subsets, respectively. The box plots represent median, interquartile range, minimum and maximum values for subset frequencies and the activation markers defined from peripheral blood cells of 43 podoconiosis (Podo) patients and 34 healthy controls (HC). P values were derived using the Mann–Whitney U test of two-sided independent t test. Source data that is used to generate this graph is provided as a “Source Data” file Figs. 1–3.

