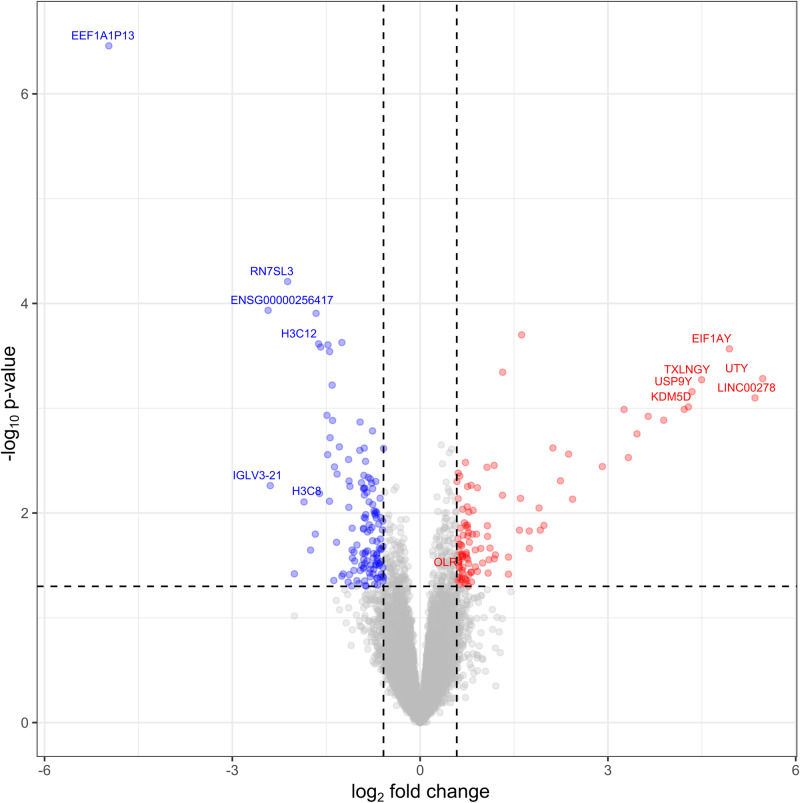
Fig. 4. Volcano plot showing fold change and P value for differentially expressed genes in podoconiosis compared to healthy controls.
Volcano plot analysis of differentially expressed genes between 19 podoconiosis patient and 15 healthy control samples. The log2-fold change values are plotted on the x axis and compared with the negative log10 P values on the y axis. Blue dots represent significantly downregulated genes, and red dots represent significantly upregulated genes in podoconiosis patients compared with healthy controls with a fold change of >1.5 and P < 0.05. The F test was used for deriving P values and adjustments were made for multiple comparison. Source data that is used to generate this graph is provided as “Source Data” file Figs. 4 and 5.

