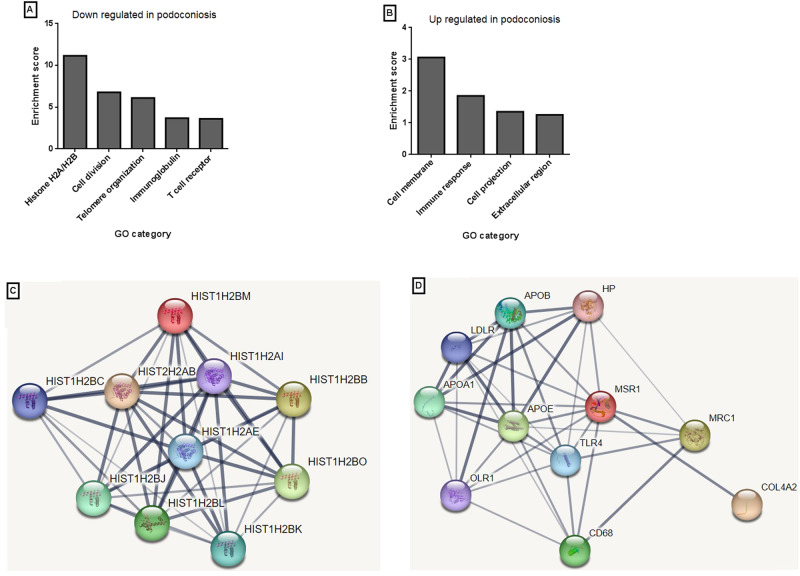
Fig. 5. Functional enrichment and protein–protein network analysis for the top upregulated and downregulated genes in podoconiosis patients relative to healthy controls.
Most enriched categories for downregulated (A) and upregulated (B) genes in podoconiosis patients. The y axis represents enrichment scores as –log10 (P value) and the x axis indicates the gene ontology (GO) category enriched in the pathway analysis. Gene names from the most enriched GO category were submitted to the STRING database for the downregulated (C) and upregulated genes (D) separately and a protein network interaction was generated for the given enriched pathway. Here nodes represent proteins with different colors representing the different submitted gene lists and additional proteins with interaction with the submitted gene lists. The lines represent known and predicted interactions between proteins, with the thickness of the line indicating the strength of interaction. The F test was used for deriving P values and adjustments were made for multiple comparison. Source data that is used to generate this graph is provided as “Source Data” file Figs. 4 and 5.

