
Fig. 2. Alzheimer’s disease (AD) risk alleles are enriched in the BHLHE41 and SPI1/PU.1 cistromes.
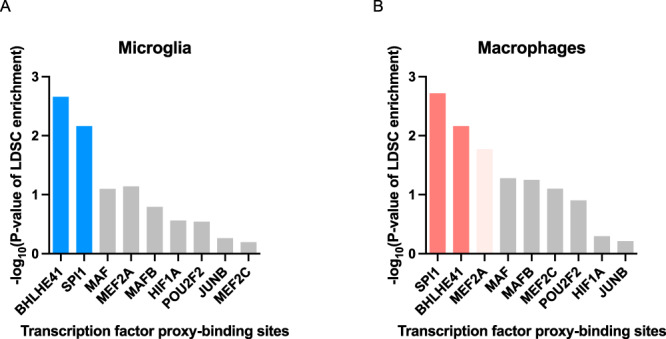
A −log10 of the nominal enrichment P values obtained from the output of the stratified LD Score Regression (LDSC) analysis of AD GWAS SNP heritability partitioned by transcription factor (TF) proxy-binding sites, which were obtained by stratifying ATAC-Seq peaks in human microglia by the presence of binding motifs for each candidate LAM TF listed on the x-axis. B −log10 of enrichment P values obtained from stratified LDSC analysis of AD GWAS SNP heritability partitioned by TF proxy-binding sites, which were obtained by stratifying ATAC-Seq peaks in human monocyte-derived macrophages by the presence of binding motifs for each candidate DLAM TF listed on the x-axis. Bars in dark blue or dark red indicate significant enrichments (FDR Adj.P value < 0.05), bars in light red indicate nominally significant enrichments (P value < 0.05), while gray bars indicate non-significant enrichments.