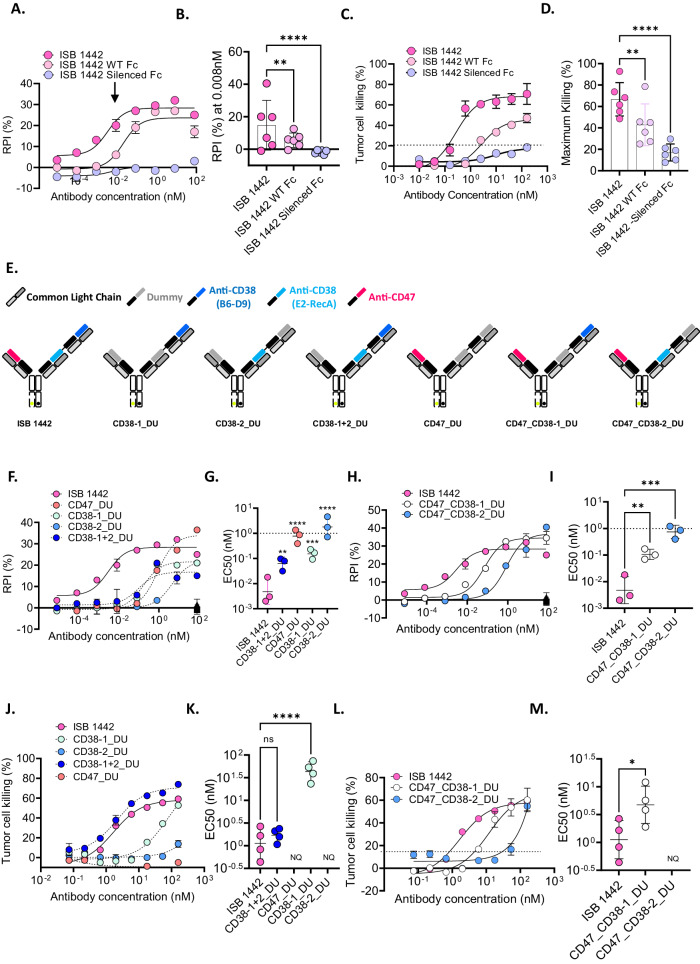
Fig. 2. Optimization of ISB 1442 architecture and Fc functions.
A Representative curves of relative phagocytosis index (RPI) of CD38low MM cells (KMS-12-BM) induced by ISB 1442 (enhanced Fc) or its respective WT or silenced Fc variants. Dots represent the mean ± SD of n = 2 of technical replicates. B Cumulative data of RPI as in (A). Bars represent mean values of phagocytosis ± SD for 6 donors measured at 0.008 nM (close to the EC50; visualized by an arrow in A). C Representative curves of CDC on CD38high (Daudi) tumor cells. Dots represent the mean ± SD of n = 2 of technical replicates. D Cumulative data of CDC as in (C). Bars represent the mean of maximal killing ± SD in 6 independent experiments. E Schematic view of ISB 1442 or its dummy controls. Gray Fabs represent the dummy binders (DU). F–M ADCP and CDC induced by ISB 1442 or its dummy controls. F–H Representative curves of RPI on CD38low MM cells (KMS-12-BM). Dots represent the mean ± SD of n = 2 of technical replicates. G–I Cumulative data of EC50 of phagocytosis as in (F–H). Bars represent mean values of RPI ± SD for 3 donors. J–L Representative curves of CDC on CD38high (Daudi) tumor cells. K–M Cumulative data of EC50 of phagocytosis of CDC as in J–L Bars represent mean values of maximal killing ± SD in 4 independent experiments. Statistics for (B–D–G–I–K–M): One-Way Anova with Tukey’s multi comparison test, with a single pooled variance. Ns not significant, *p < 0.05, ***p < 0.001, ****p < 0.0001, ****p < 0.0001.

