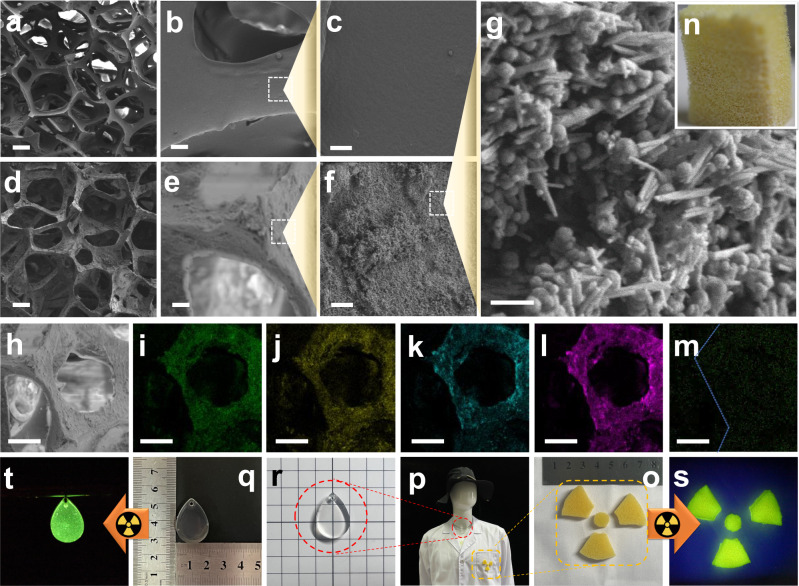
Fig. 5. Micromorphology results and application in monitoring X-ray.
a Scanning electron microscope (SEM) images of pristine polyurethane foam (PUF) (bar: 200 μm). b SEM images of pristine PUF (bar: 20 μm). c SEM images of pristine PUF (bar: 5 μm). d SEM images of Tb3+-doped Na5Lu9F32 anchored halloysite nanotubes coated polyurethane foam (HNTs@Na5Lu9F32:Tb3+@PUF) (bar: 200 μm). e SEM images of HNTs@Na5Lu9F32:Tb3+@PUF (bar: 20 μm). f SEM images of HNTs@Na5Lu9F32:Tb3+@PUF (bar: 5 μm). g SEM images of HNTs@Na5Lu9F32:Tb3+@PUF (bar: 500 nm). h SEM images of HNTs@Na5Lu9F32:Tb3+@PUF (bar: 100 μm). i–m Elemental mapping images of HNTs@Na5Lu9F32:Tb3+@PUF (i Al, m Si, k Na, l F, and m Tb; bar: 100 μm). n Photograph of HNTs@Na5Lu9F32:Tb3+@PUF taken under normal light. o Photograph of HNTs@Na5Lu9F32:Tb3+@PUF fabricated into desired shapes. p Photograph of the mannequin wearing special-made lab coat and drop shape pendant. q Photograph of the drop shape pendant under normal light. r Illustration of the transparency of the drop shape pendant. s Photograph of HNTs@Na5Lu9F32:Tb3+@PUF taken under X-ray (3.1 cGy s−1). t Photograph of the drop shape pendant taken under X-ray (3.1 cGy s−1).

