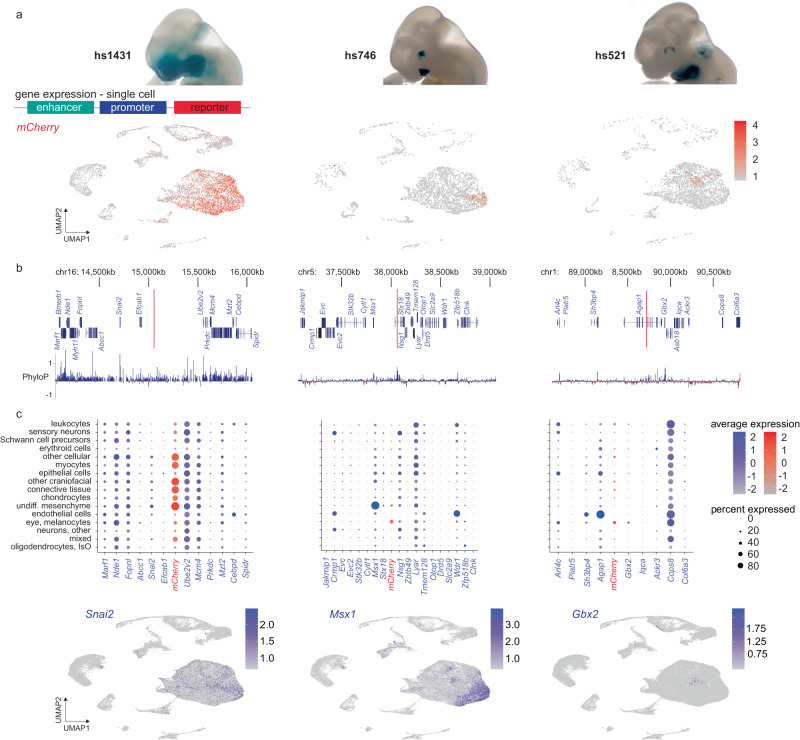
Fig. 6. Enhancer activity at single-cell resolution.
a in vivo activity pattern of select craniofacial enhancers (hs1431, hs746, hs521) at e11.5, visualized by lacZ-reporter assays (top). In separate experiments, the same enhancers were coupled to a mCherry-fluorescent reporter gene and examined by scRNA-seq of craniofacial tissues of resulting embryos. UMAPs show enhancer-driven mCherry expression (see Fig. 3a for reference). b Location of enhancers hs1431, hs746 and hs521 in their respective genomic context (red vertical lines), along with protein-coding genes within the genomic regions and local conservation profile (PhyloP). c Seurat-based average expression of genes in the vicinity of the respective enhancers, and proportion (percent) of cells expressing those genes in annotated cell types. Enhancer-driven mCherry signal is plotted in the center in between the names of the two genes whose promoters are closest to its location within the genome. For example, for hs1431, mCherry is highly expressed (indicated by red color intensity) in clusters labeled “other cellular”, “myocytes”, “skeletal, other”, “connective tissue”, and “undifferentiated mesenchyme”, while it is also expressed in a larger proportion of cells (indicated by greater diameter of the circles) in those same clusters. In the same plot, Snai2 is highly expressed (indicated by blue color intensity) in a subset of cells (indicated by lesser diameter of circles) in identical clusters as compared to mCherry. Bottom panels show the expression of Snai2, Msx1, and Gbx2 as likely candidate target genes for each of the enhancers hs1431, hs746 and hs521 across UMAPs. undiff. undifferentiated, IsO: Isthmic Organizer Cells. Source data are provided as a publicly accessible Seurat/R object file, see Data Availability Statement for details.

