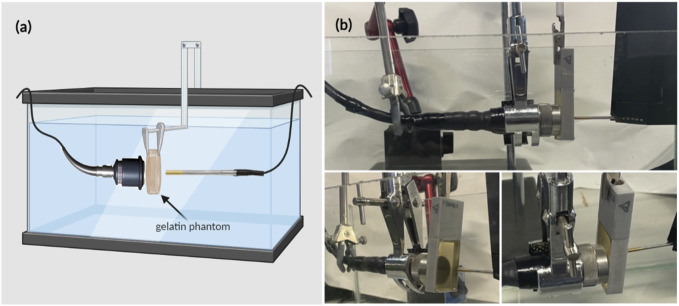
FIGURE 2.
Experimental setup for estimating the acoustic intensity and attenuation coefficient when the gelatin phantoms, of different concentrations, were introduced. (A) Schematic diagram of the experimental setup including the gelatin phantom in place in front of the face of the transducer. (B) Real-time images showing the ultrasonic signal acquisition setup arrangement, from different views, in which the phantom was held (by the rectangular phantom holder) between the transducer and the hydrophone.

