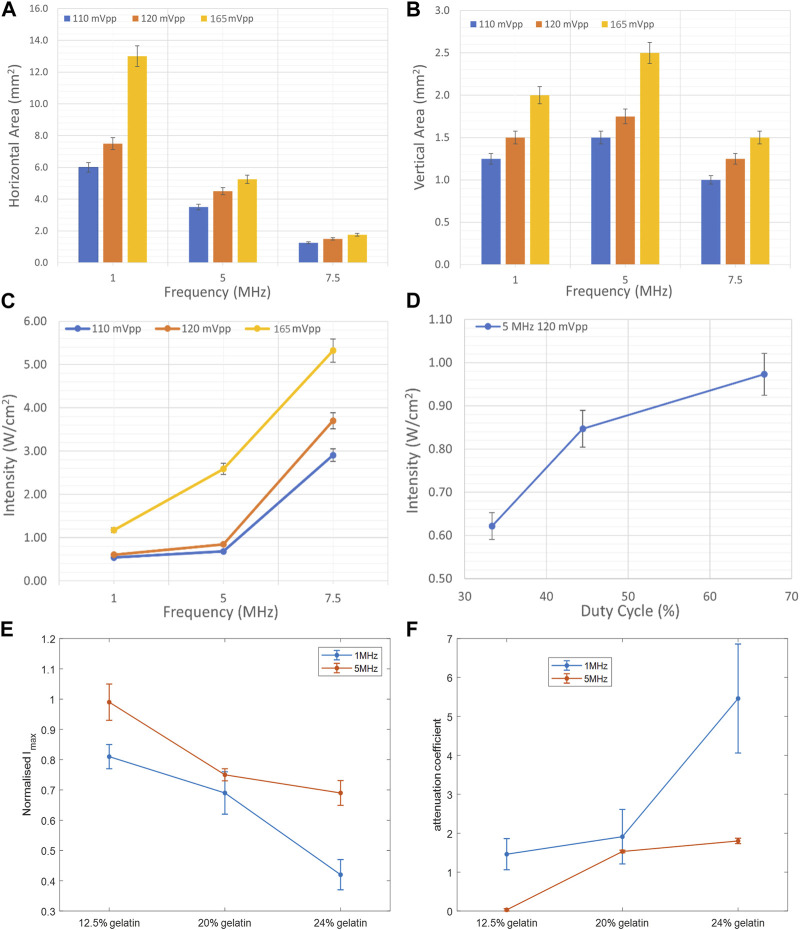
FIGURE 7.
Effect of frequency, duty cycle, and gelatin concentration on the focal area and acoustic intensity. (A) Variation of the horizontal area at the horizontal midplane as a function of ultrasound frequency and voltage. (B) Variation of the area at the vertical cross section at the focal point as a function of ultrasound frequency and voltage. (C) Increase in the maximal intensity at the focal region as a function of increasing acoustic frequency and voltage. (D) Increase in the maximal intensity at the focal region as a function of increased duty cycle with the 5 MHz transducer at a voltage of 120 mV. Variation of the normalized maximal intensity (E) and attenuation coefficient (F) as a function of gelatin concentration, recorded while using the 1 MHz frequency and 5 MHz frequency transducers.

