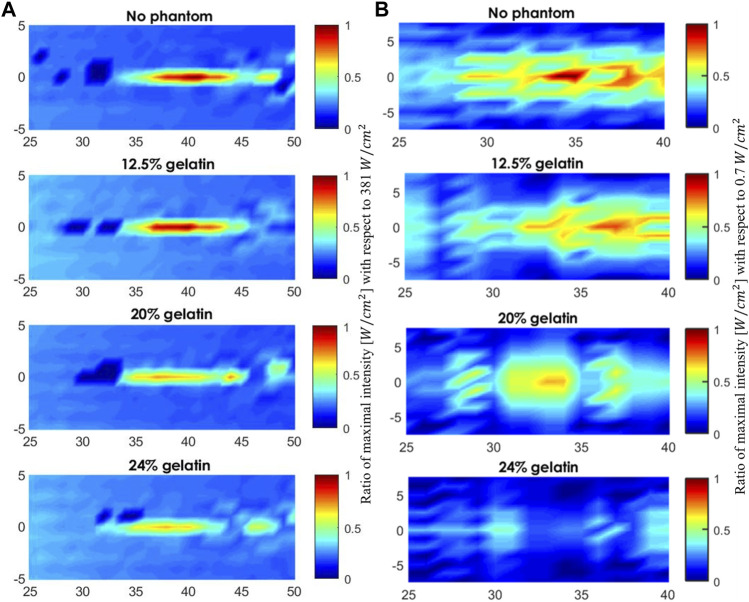
FIGURE 8.
Acoustic profile of the mid-horizontal plane in front of the face of the transducer. (A) The scanned volume without a phantom placed and when the 12.5%, 20%, and 24% gelatin-based phantoms were positioned in place respectively using the 5 MHz transducer (A) and using the 1 MHz transducer (B). The acoustic profiles display the maximal intensities plotted as a function of the maximal intensity recorded in water for visual inspection of the drop in intensity.

