
Fig. 4. Validation of the main effects induced by the cranberry extract supplementation by quantitative PCR.
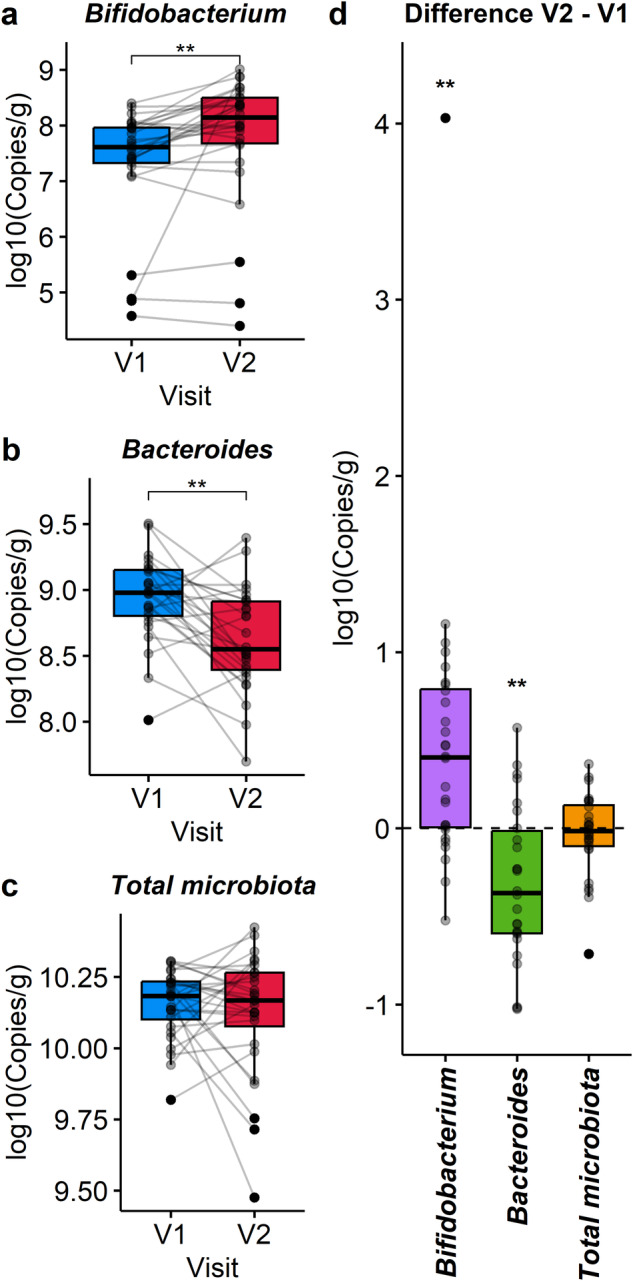
Results are represented as boxplots showing the paired microbiota samples (a–c) and the difference between V2 – V1 (d) of the selected genera Bifidobacterium and Bacteroides, as well as the total microbiota. Statistical significance was assessed with a paired Wilcoxon test adjusted for multiple comparisons using the Benjamini & Hochberg method. Results of the statistical analysis were represented with asterisks (*p ≤ 0.05, **p ≤ 0.01, ***p ≤ 0.001, ****p ≤ 0.0001). The center of the boxplots represents the median, the borders represent the first and third quartiles and the whiskers represent the minimum and maximum.