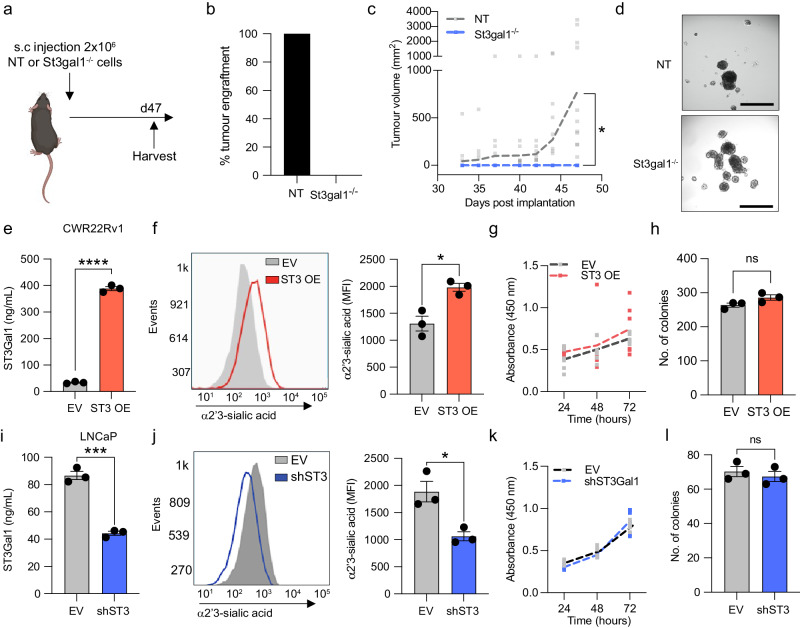
Fig. 3. St3gal1-null cells fail to grow in C57BL/6 mice (a) Schematic of St3gal1-/- TRAMP-C2 allograft experimental design.
Schematic created with BioRender.com b Percentage tumour engraftment rate for non-targeting (NT) sgRNA control and St3gal1-/-TRAMP-C2 cells. N = 16 mice/group. c Tumour growth curves for NT and St3gal1-/- TRAMP-C2 allografts. d Representative images of NT and St3gal1-/- TRAMP-C2 spheroid formation in vitro. Images were taken of 9 spheroids per group and quantified. Scale bar = 200 µm. e Protein expression of ST3GAL1 in empty vector (EV) and ST3GAL1 overexpression (OE) lentiviral transduced CWR22Rv1 cells. Levels quantified by ELISA. N = 3 biologically independent samples. f Quantification of α2-3-sialylation in CWR22Rv1 EV and ST3GAL1 OE cells using the MAL-II by flow cytometry. Representative histogram of N = 3 biologically independent samples and bar chart of median fluorescent intensities. g Cellular proliferation of EV and ST3GAL1 overexpression lentiviral transduced CWR22Rv1 cells quantified by WST1 assay. Absorbance was read at 450 nm and normalised to background absorbance. N = 6 biologically independent samples. h Colony forming ability of EV and ST3GAL1 overexpression lentiviral transduced CWR22Rv1 cells measured using a colony forming assay. Graph shows the number of colonies formed. N = 3 biologically independent samples. i Protein expression of ST3GAL1 in EV and shST3Gal1 knockdown lentiviral transduced LNCaP cells. Levels quantified by ELISA. N = 3 biologically independent samples. j Quantification of α2-3-sialylation in LNCaP EV and shST3GAL1 cells using the MAL-II by flow cytometry. Representative histogram of N = 3 biologically independent samples and bar chart of median fluorescent intensities. k Cellular proliferation of EV and shST3GAL1 lentiviral transduced LNCaP cells quantified by WST-1 assay. Absorbance was read at 450 nm and normalised to background absorbance. N = 6 biologically independent samples. l Colony-forming ability of EV and shST3GAL1 lentiviral transduced LNCaP cells measured using a colony-forming assay. Graph shows number of colonies formed. N = 3 biologically independent samples. Significance tested using two-way t-tests. Statistical significance is shown as * p < 0.05, ** p < 0.01, *** p < 0.001 and **** p < 0.0001. Error bars show standard error of the mean.

