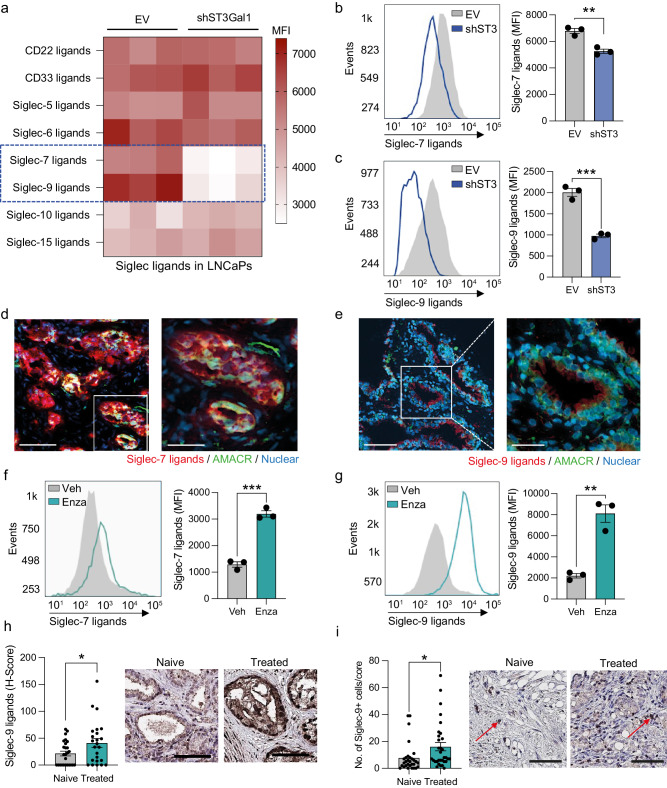
Fig. 4. Siglec-7 and Siglec-9 ligands are synthesised by ST3Gal1 and upregulated by AR targeting therapies (a) Heatmap showing siglec binding capabilities in LNCaP empty vector (EV) and shST3GAL1 knockdown cells as determined by flow cytometry using Siglec-Fc reagents.
Significant changes in Siglec-7 and Siglec-9 binding capacity are highlighted in the blue dashed box. N = 3 biologically independent samples. Data are median fluorescent intensities. b–c Quantification of Siglec-7 and Siglec-9 binding capacity in CWR22Rv1 EV and shST3GAL1 cells using Siglec-Fc reagents. Representative histogram of N = 3 biologically independent samples and bar chart with median fluorescent intensities shown. d Siglec-7 ligands (red) colocalized with AMACR (green) in prostate cancer patient biopsies using dual immunofluorescence. Images prepared using a ZEISS Axio Imager2 microscope with a x20 and x40 objective. Scale bar = 150 µm. e Siglec-9 ligands (red) colocalized with Alpha-methylacyl-CoA racemase (AMACR) (green) in prostate cancer patient biopsies using dual immunofluorescence. Images prepared using a ZEISS Axio Imager2 microscope with a x20 and x40 objective. Scale bar = 150 µm. f Quantification of Siglec-7 ligands using Siglec-Fc reagents in LNCaP cells treated with vehicle or 10 µM enzalutamide. Representative histogram of N = 3 biologically independent samples and bar chart with median fluorescent intensities shown. g Quantification of Siglec-9 ligands using Siglec-Fc reagents in LNCaP cells treated with vehicle or 10 µM enzalutamide. Representative histogram of N = 3 biologically independent samples and bar chart with median fluorescent intensities shown. h Immunohistochemistry detection of Siglec-9 ligands using Siglec-Fc reagents in a tissue microarray (TMA). Patients include those who are treatment naïve (N = 26) and those who have been exposed to androgen deprivation therapy (N = 24). H-scores were generated to quantify staining in epithelial cells using a Leica Aperio slide scanner. Representative images shown. Scale bar = 300 µm. i Immunohistochemistry detection of Siglec-9 in a tissue microarray (TMA). Patients include those who are treatment naïve (N = 30) and those who have been exposed to androgen deprivation therapy (N = 32). The number of positive Siglec-9+ cells were quantified per tissue core. Representative images shown. Examples of Siglec-9+ ells highlighted with red arrows. Scale bar = 200 µm. Significance tested two-way t-tests. Statistical significance is shown as * p < 0.05, ** p < 0.01, *** p < 0.001 and **** p < 0.0001. Error bars show standard error of the mea.

