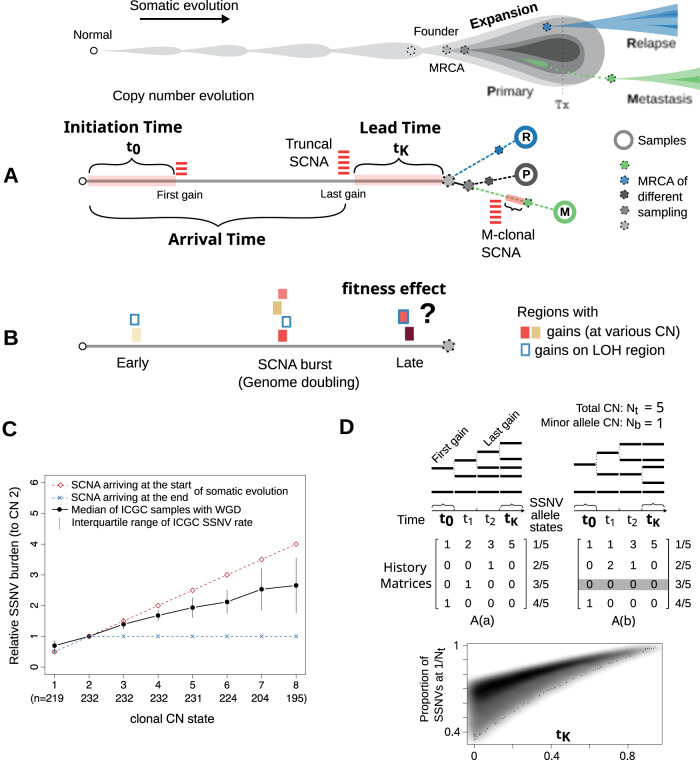
Fig. 1. Measuring the arrival and initiation time of SCNAs.
A drawing at the top marks the concept of cancer somatic evolution, which leads to the birth of the most recent common ancestor (MRCA) of the primary tumor, as well as the roots of secondary tumors. Tx: treatment. A For an SCNA present within the MRCA of a sampling-relevant tumor expansion, we aim to characterize the time when the last gain and first gain appeared (referred to as arrival and initiation time, respectively) for the corresponding genomic region. B We further aim to address the question if the late truncal gains are neutral or beneficial to tumor evolution. C The solid black line shows that the burden of SSNVs of a given genomic locus correlates with its CN state in tumors sequenced by ICGC (n: the number of independent samples with whole genome doubling). Two dashed lines assume the two extreme scenarios of SCNA arrival time. D The proportion of SSNVs at different allele states depends on the SCNA history matrix and the relative time span of each CN stage. Two possible history matrices are shown with the SCNA at 5:1. A 2D density plot in grayscale shows the burden of single-copy SSNVs against the lead time (tK) simulated using the two matrices. Source data are provided as a Source Data file.

