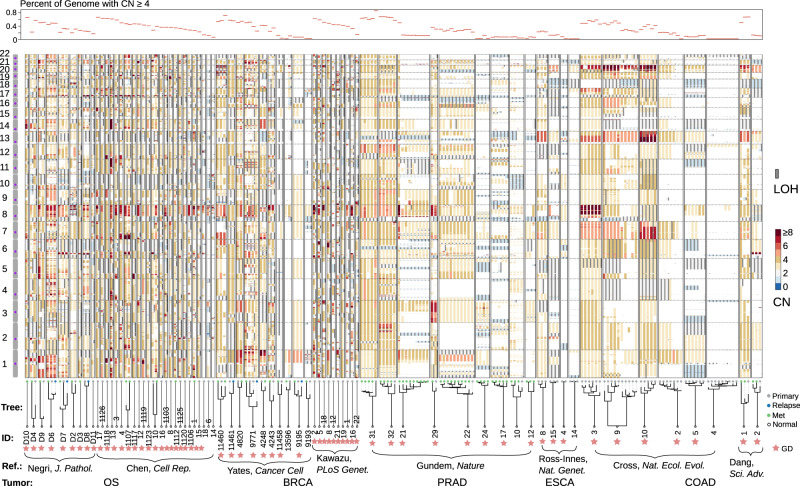
Fig. 3. CN profiles across five tumor types from the re-analysis of published WGS data.
Vertical bars represent the segmental CN states along the autosomal chromosomes characterized by the WGS data of tumor samples. For each sample, a color-coded thick bar shows the total CN state of each genomic locus and a thin gray bar to the right indicates that region has loss of heterozygosity (LOH). Samples belonging to the same patient are boxed. The top panel highlights the fraction of high CN states in each sample’s genome. The lower panel exhibits the sample phylogenetic trees constructed from SSNVs. Sample IDs, the reference where the WGS data was published, and tumor types are tabulated at the bottom. Presence of GD are indicated. In this manuscript, a tumor sample is named after the concatenation of the tumor type, the first character of the author’s surname and the patient ID. Source data are provided as a Source Data file.

