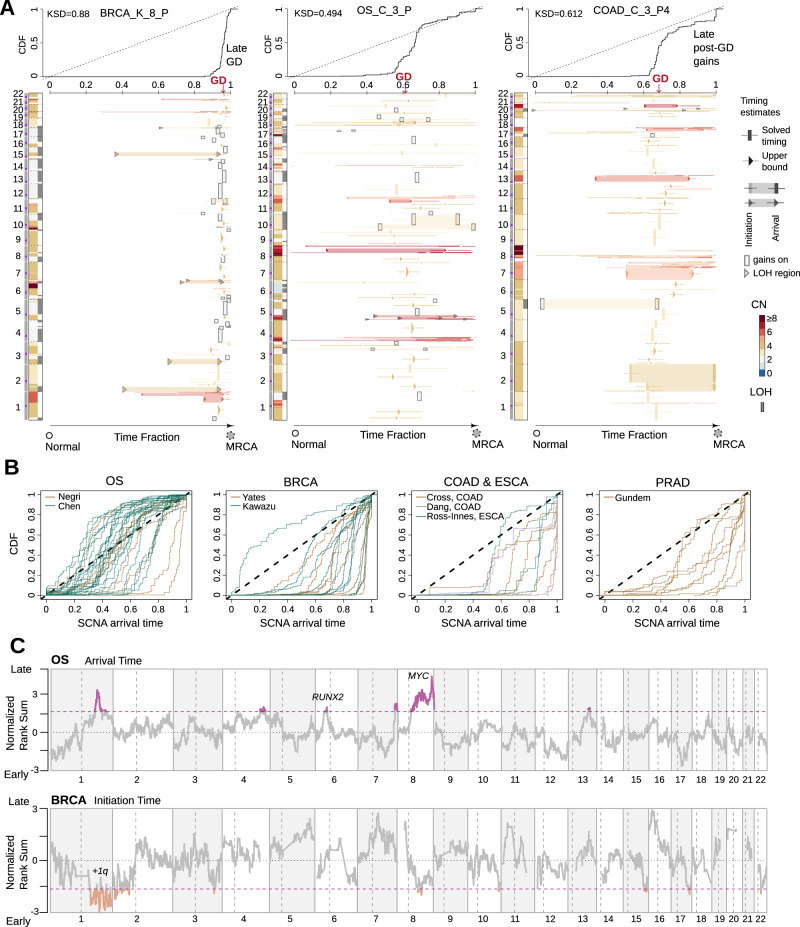
Fig. 4. The timing patterns of SCNAs across five tumor types.
A SCNA timing of three exemplified tumors. CN states along the genome are shown on the left of each panel. The right panel visualizes the time fraction of somatic evolution from germline to the MRCA of the patient tumor. For each SCNA segment, the inferred time points for its initiation and arrival are shown as either rectangles (exactly solved timing) or arrows (upper bounds of timing when the solutions are not unique) with the same color-coding as its CN. Confidence interval of the inferred timing is drawn by lines. The top panel shows the cumulative distribution (CDF) of SCNA arrival time. B The CDF curve of SCNA arrival time is shown for each patient categorized by the tumor type. C The figure displays normalized rank sums of timing across patients for each genomic bin, representing initiation time for BRCA and arrival time for OS (see Methods). Color-highlighted bins indicate recurrent early-initiating gains for BRCA and recurrent gains established late for OS (with 90% confidence level). Source data are provided as a Source Data file.

