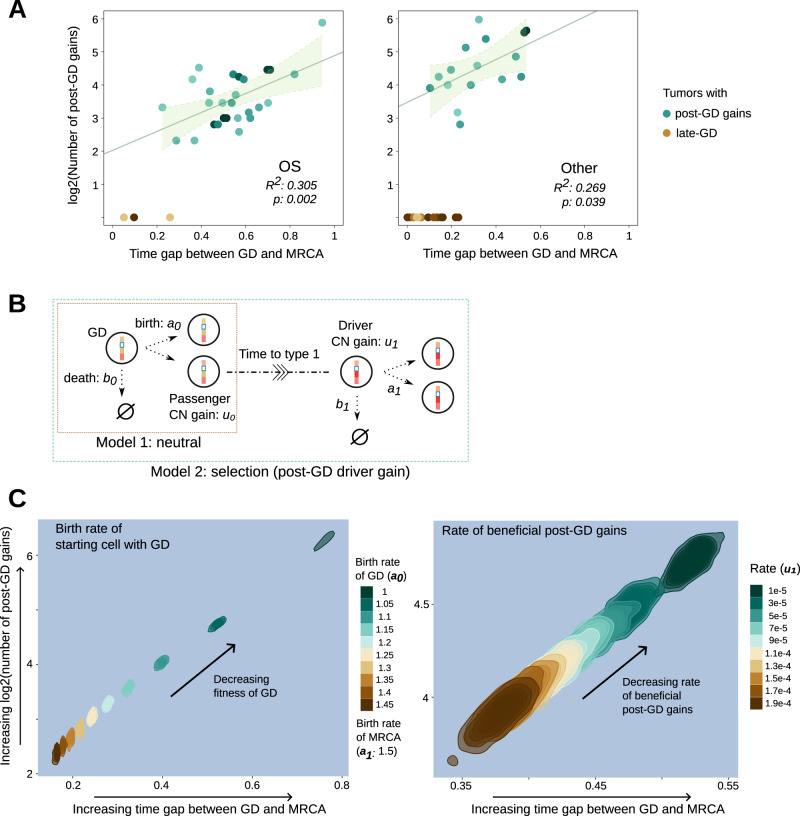
Fig. 5. Mathematical modeling suggests that final-expansion driver gains should occur late.
A Scatter plots colored by density illustrate the number of post GD gains (in log2 scale) against the time fraction of post-GD evolution towards MRCA for OS and other adult cancer types, respectively. The green center line represents the fitted regression line (for tumors with post-GD gains) and the the green error bands represent the 95% confidence interval limits (with R2 and p values as noted). B The schema shows the setup of the two contrasting mathematical models: (1) GD is followed by neutral evolution where additional gains do not confer a fitness advantage and (2) post-GD gains increase the growth rate. C 2D density plots of the two metrics as in panel 5A characterized by the selection model. We studied the effects of the growth rate of GD (with a fixed growth rate of the MRCA, the left panel) and the rate of beneficial post-GD driver gains (the right panel), respectively. We simulated 10,000 cases for each parameter setting. The density is produced from smoothed data points with each point referring to an average of 50 cases. To convert the post-GD evolution time in the simulation into fractions as in (A), we assume that GD occurs at 120 time units (roughly corresponds to a GD rate of 7 × 10⁻⁵ 82 during pre-GD evolution with a birth and death rate at 1.1 and 1, respectively). Note that the modeling is not intended to infer the parameters from patient data. Left panel: b0 = 1, a1 = 1.5, b1 = 1, u0 = 0.245, and u1 = 0.00001; right panel: a0 = 1.05, b0 = 1, a1 = 1.5, b1 = 1, and u0 = 0.2. Source data are provided as a Source Data file.

