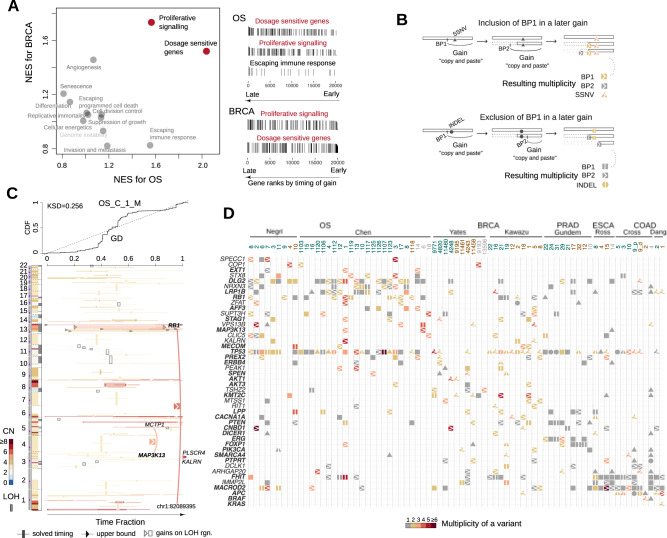
Fig. 6. Ways the late CN gains contribute to the fitness of cancer progenitor cell.
A The gene set enrichment analysis (GSEA) was performed on the gene list ranked by the averaged CN arrival time for BRCA and OS tumors, respectively. The scatter plot on the left shows the normalized enrichment scores (NES) for each set of cancer census genes belonging to the predefined cancer hallmarks by COSMIC database. Red-colored highlighted pathways have a false discovery rate less than 0.15. The vertical bars on the right panels visualize the timing-ranks of genes that belong to the highlighted gene sets. The height of each bar corresponds to the arrival time. B A cartoon illustrates the multiplicity increase of an early sequence variant due to the inclusion of that variant by a late CN gain, with annotations indicating the type of variants (symbol shapes), level of multiplicity (color hues) and the variants' association with a late gain (right arrow) or an early gain (vertical bar). BP: breakpoint. C The SCNA timing plot of an example OS tumor similarly arranged as in Fig. 4, with additional links and symbols highlighting the SV breakpoints in known cancer genes that are amplified by late gains. D The matrix plot demonstrates genes with recurrent somatic variants and their multiplicity across the five tumor types. Note that a high multiplicity indicates that an early somatic variants gained more copies of the mutant. Names for known cancer genes are in bold. Genes with variants showing higher multiplicity levels than gene TTN are also included. Symbol annotations are the same as in (B). Source data are provided as a Source Data file.

