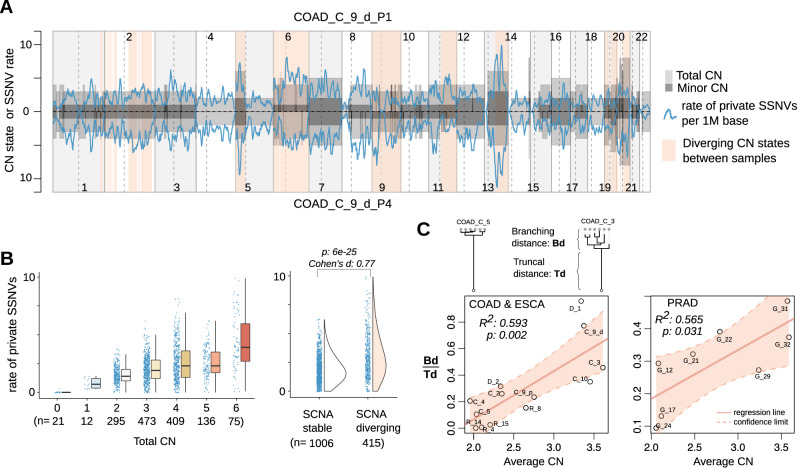
Fig. 7. The effect of SCNA on SSNV diversification during tumor expansion.
A The rate of sample-private SSNVs when comparing two samples of a COAD patient tumor. The segmental CN states (total and minor CN) along the autosomal chromosomes for the two tumor samples are shown as gray rectangles above and below the x axis. The rate of sample private SSNVs (per million base pairs, blue line) fluctuates with the CN states, supporting the assumption that point mutations accumulate at a rate proportional to their CN. Genomic regions with different CN states between the two samples are in light red background. B The box plots on the left panel illustrate the rate of private SSNVs in sample P1 detected in regions at a given total CN state. The box represents the interquartile range, covering the central 50% of the data. The line inside the box indicates the median. Whiskers extend to the minimum and maximum values within a specified range, excluding outliers. The half-violin plots on the right panel demonstrate such a rate for regions showing stable or diverging CN states between the two samples with p value of Wilcoxon rank sum test (two-sided, W value = 136214 and 95% confidence interval ranges from 0.7 to 1) and effect size indicated. C The branching distance relative to truncal distance in a tumor’s phylogenetic tree was calculated for each of the COAD, ESCA and PRAD tumors to evaluate the correlation with the averaged CN of the corresponding tumor samples. Annotations show the percentage of variance explained by a linear regression model (with p values of the model fitting shown). Source data are provided as a Source Data file.

